Figure 1.

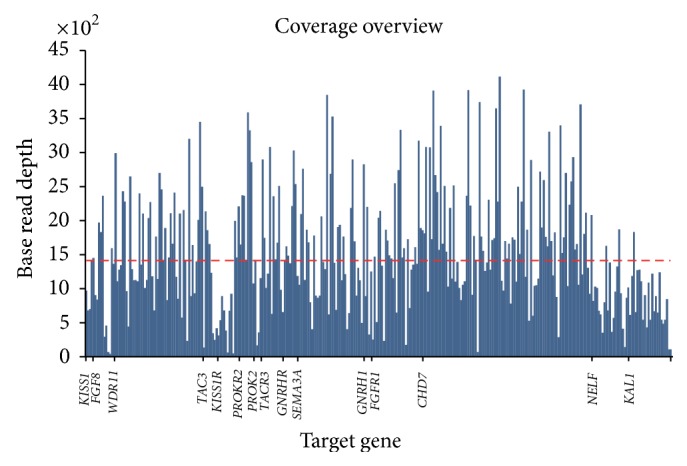
The sequencing coverage of the 15 genes from the ten samples. Blue graphs represent the distribution of coverage of 15 IHH genes from 10 samples. The dashed line is the mean coverage (1402X) of the 15 IHH genes.

The sequencing coverage of the 15 genes from the ten samples. Blue graphs represent the distribution of coverage of 15 IHH genes from 10 samples. The dashed line is the mean coverage (1402X) of the 15 IHH genes.