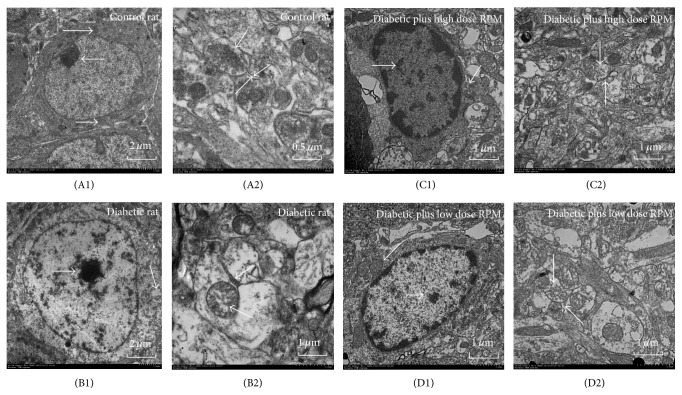
Figure 3.
The ultrastructure of neuronal cells (A1, B1, C1, and D1) and synapses (A2, B2, C2, and D2) of hippocampal tissue in rats of each group. A: control rat; B: diabetic rat; C: diabetic plus high dose RPM; D: diabetic plus low dose RPM. Control rats showed regular nuclear morphology (Figure 3(A1)), large number of synapses in complete form, and rich synaptic vesicles (Figure 3(A2)). Nuclear membrane shrinkage was observed in diabetic rats and cell membrane structure was also unclear (Figure 3(B1)). Figure 3(B2) showed significantly reduced number of synapses, abnormal synaptic structure, and blur or missing synaptic cleft. Rat neuronal cell structure in diabetic plus RPM had been greatly improved compared with diabetic rats, in which diabetic plus high dose RPM was significantly higher than of in low dose RPM (Figures 3(C1), 3(D1) 3(C2), and 3(D2)).

