Figure 2.

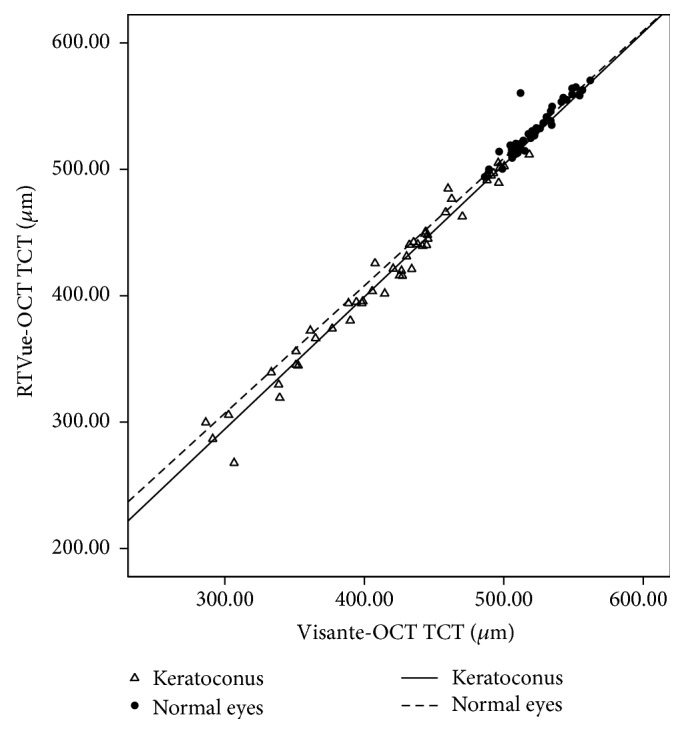
Scatterplot showing the relationship of the TCT values between RTVue-OCT and Visante-OCT in keratoconic and normal eyes.

Scatterplot showing the relationship of the TCT values between RTVue-OCT and Visante-OCT in keratoconic and normal eyes.