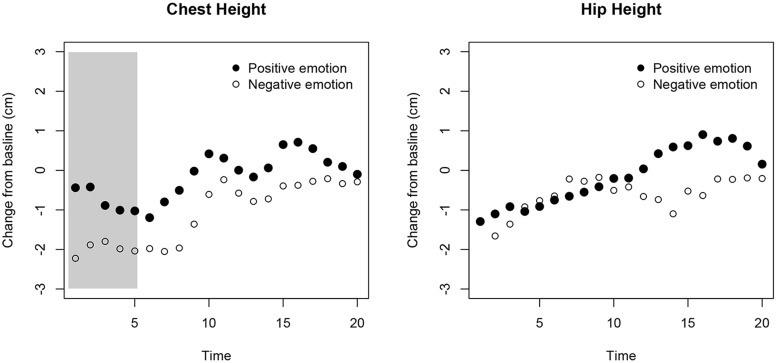
FIGURE 5.
Results from the adult validation study. The x-axis represents the time after the emotion was elicited and as adults walked toward the Kinect. The y-axis shows the relative change in height for participants’ chest (left) and hip (right). At each time point the median for the two positive and the two negative emotions is plotted. The gray area marks the time window where the difference between the two types of emotions was statistically significant (corrected for multiple testing).

