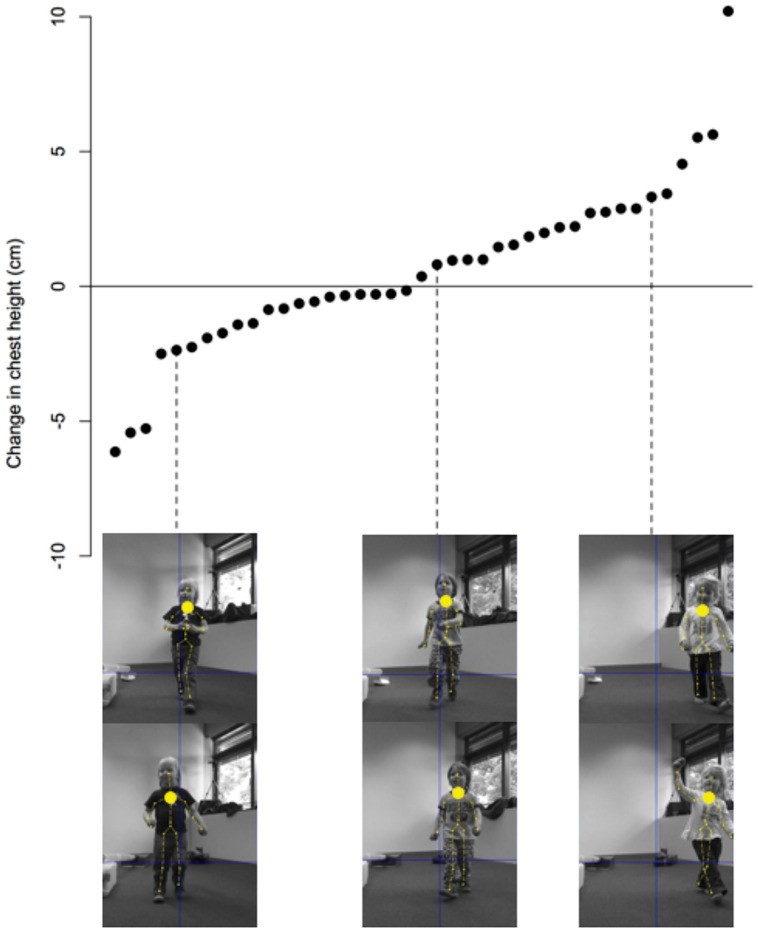
FIGURE 7.
An illustration of the data collected by the Kinect camera. Each data point represents the change in the height of the chest’s center for each participant. The values are sorted from the lowest change to the largest change in height. For three participants illustrations are provided from the baseline sequence (top row) and from the later taken process sequence (bottom row).

