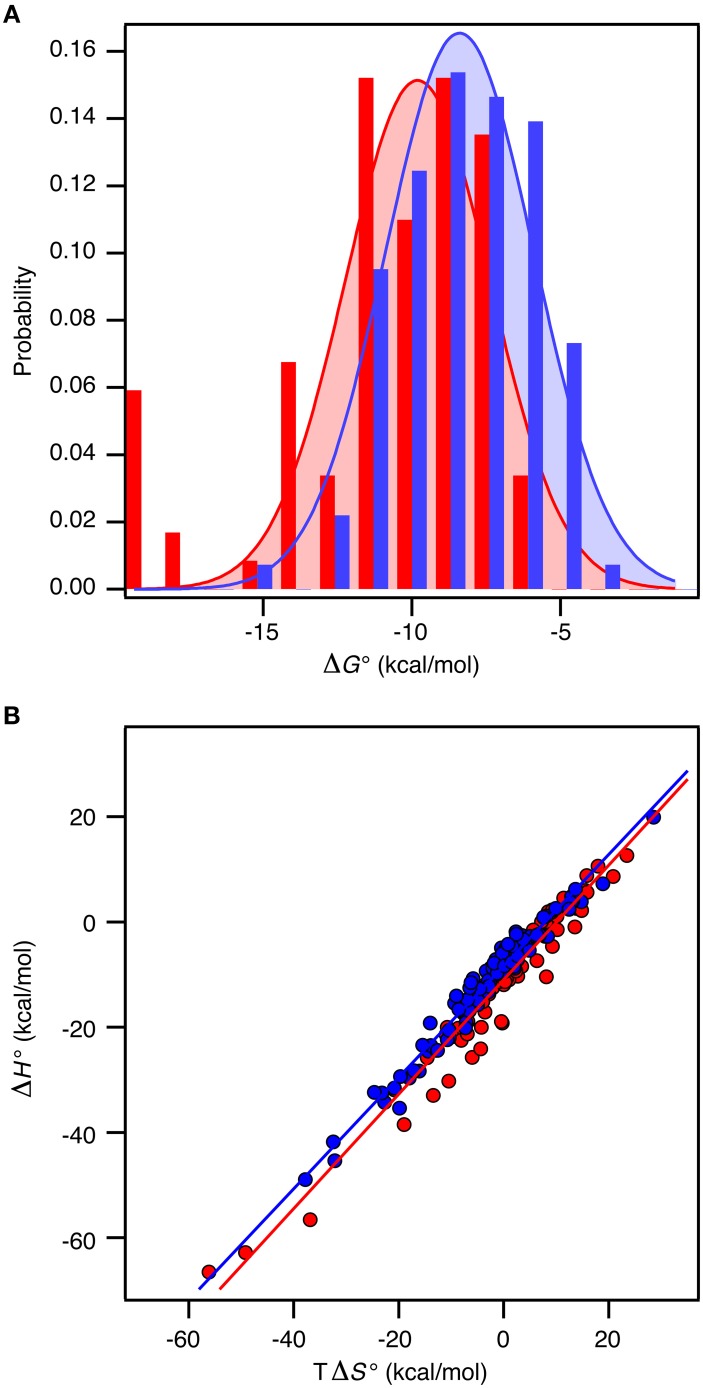
Figure 2.
Thermodynamics of 196 protein-protein complexes. (A) Histogram of the binding free energy, ΔG°, for complexes between two ordered proteins (red) and one ordered and one disordered protein (blue). Both distributions were fit to a Gaussian distribution (solid lines). (B) Plot of ΔH° versus TΔS° for the same protein–protein complexes with the same color code as in (A). The solid lines represent the best linear fits to the data.

