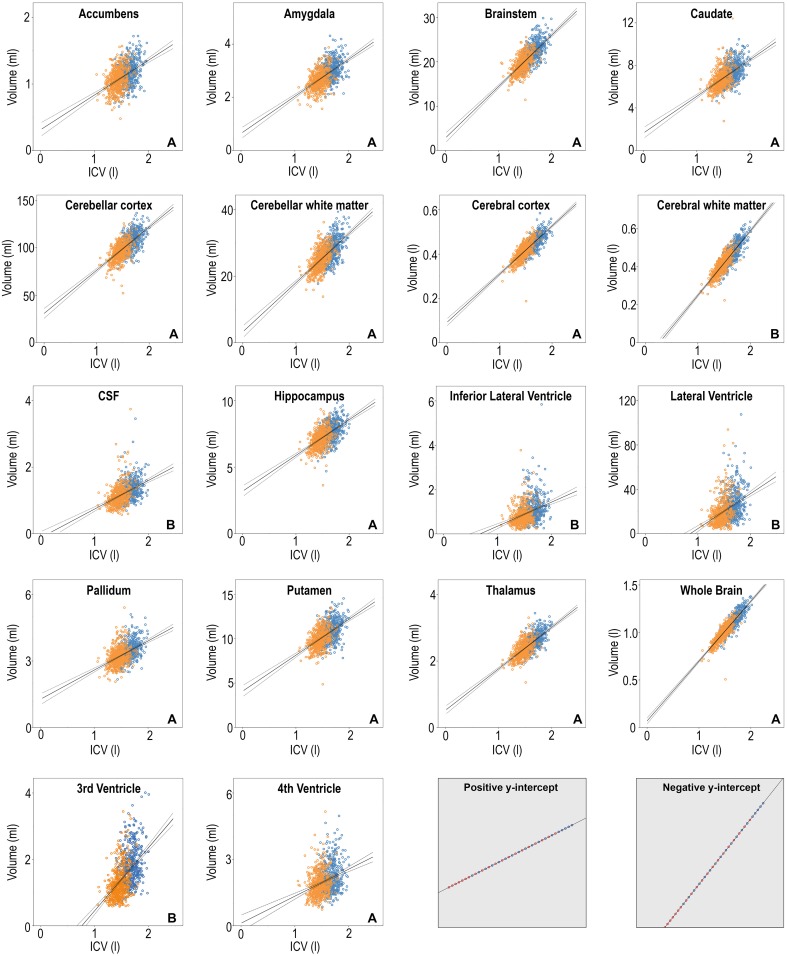
Figure 4.
Scatterplots of the volumes of the 18 neuroanatomical structures vs. ICV, women in orange and men in blue. The linear regression line for all subjects combined is superimposed in solid line with the 95% confidence interval in dashed. Y-axis: structural volume, x-axis: ICV. The letter A or B in the lower right corner of each neuroantomical volume indicates whether the y-intercept in the regression line is positive or negative. The two gray squares in the lower right corner involve imaginary data. In these cases, a sex difference is clearly not present. The proportions method would however show significant effect of sex because the regression line does not have zero y-intercept.

