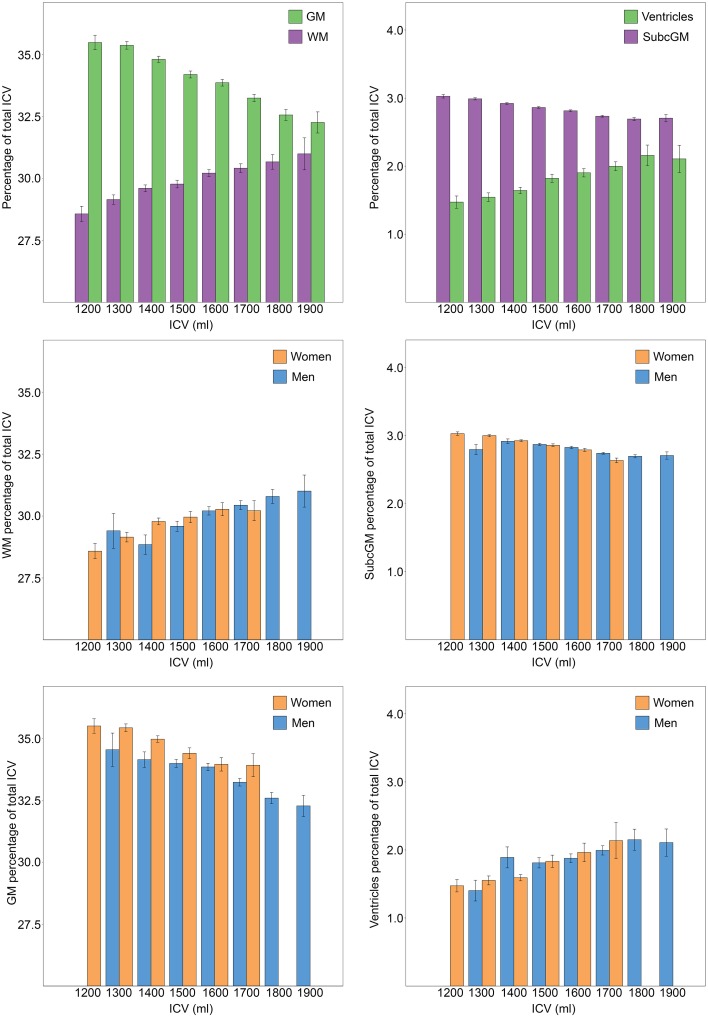
Figure 5.
Relationship between ICV and brain tissue types. ICV was stratified in groups of 100 ml and groups with less than five participants were excluded. The bars illustrate the relative size (% of ICV) of different brain tissue types with the standard error superimposed. The two top charts are from analysis performed on men and women combined (n = 966). A significant effect of ICV was found for all brain tissue types; the relative size of cortical and subcortical gray matter decreased with increasing ICV, the opposite was found for the relative size of white matter and the ventricles. The lower four charts display the relationship between different brain tissue types and ICV for each sex separately. Women had a significantly larger relative size of gray matter. No effect of sex was found for any of the other investigated brain tissue types. GM, gray matter; WM, white matter; SubcGM, subcortical gray matter.

