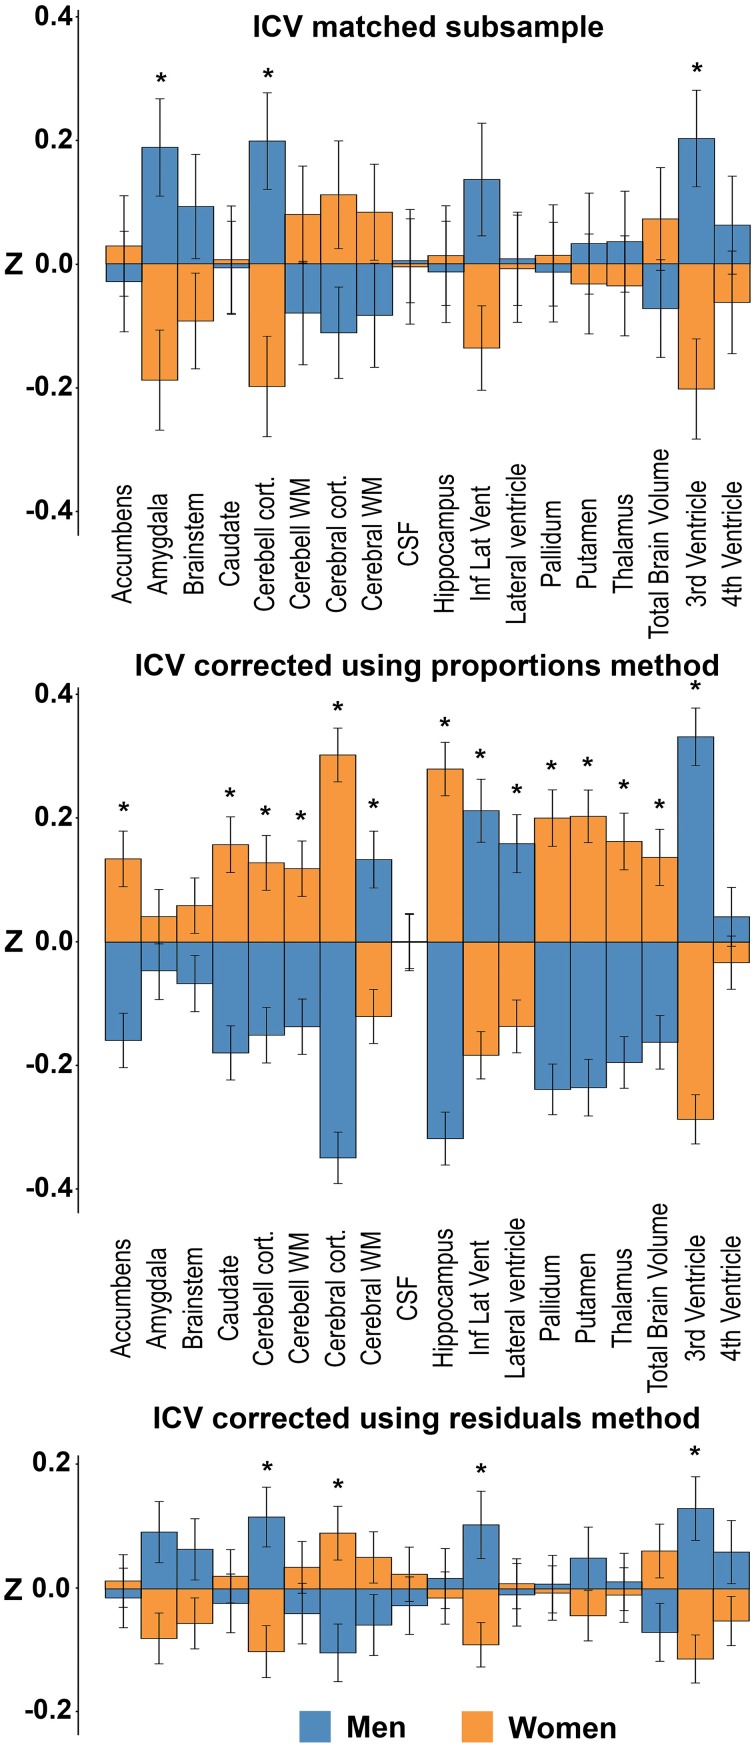
Figure 6.
Sex differences in the ICV-matched subsample and using the different ICV-correction methods. The bars illustrate mean standardized volume for men (blue) and women (orange) with the standard error superimposed. Y-axis: Z-score of the residuals. Top: ICV-matched subsample. Middle: ICV-corrected using the proportions method. Bottom: ICV-corrected using the residuals method. *Corrected p < 0.05.

