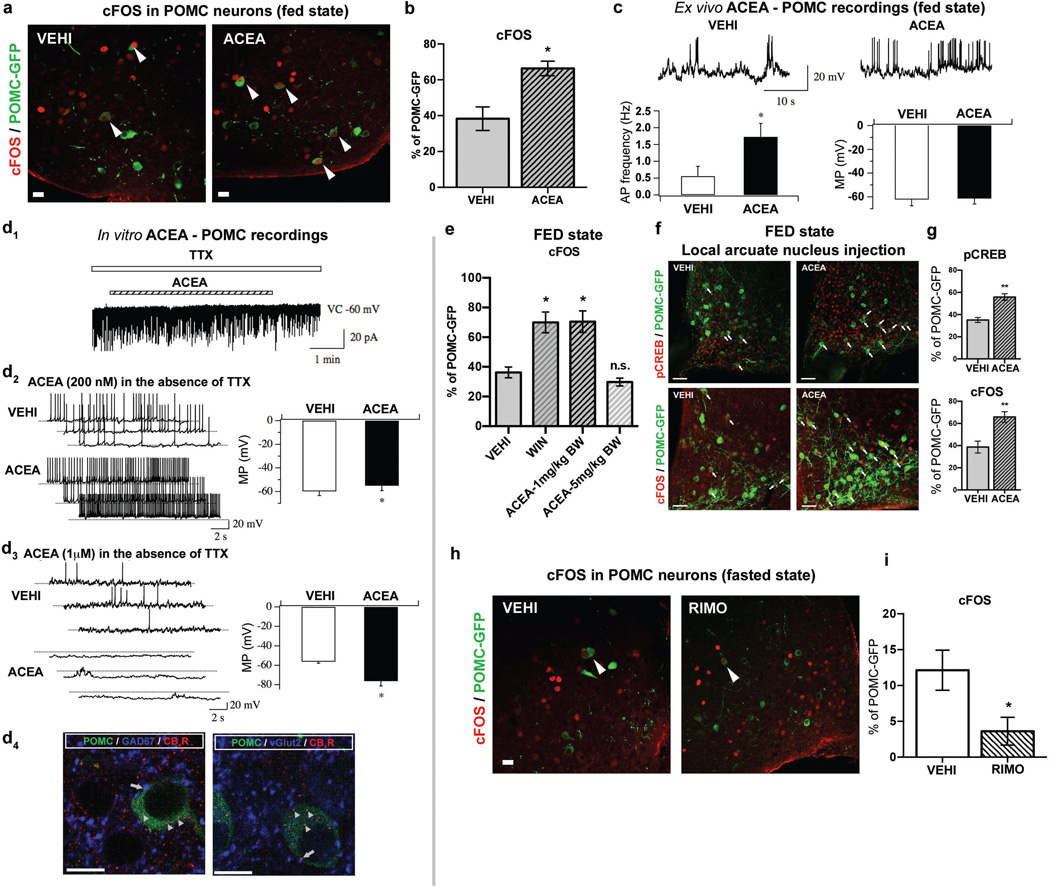
Fig. 1. CB1R-driven paradoxical POMC activation.
a, b In fed mice, ACEA increased POMC cFOS (VEHI, n=5 mice, 38.3±6.6%; ACEA, n=4, 66.4±4.1%; * P <0.05). c ACEA increased POMC action potential (AP) frequency (left, Vehicle, n=22 cells/7 mice, 0.56±0.29 Hz; ACEA, n=22/7, 1.73±0.4 Hz; * P <0.05). POMC membrane potential (MP; right, Vehicle, −61.1±2.7 mV; ACEA, −60.7±2.3 mV). d1 In the presence of TTX, ACEA failed to alter POMC membrane potential (4/4 cells). d2 Without TTX, 200 nM ACEA depolarized POMC neurons (vehicle, n=6 cells, −59.8±3.7 mV; ACEA, n=6, −55.0±4.2 mV; * P <0.05). d3 1 µM ACEA hyperpolarized POMC neurons (vehicle, n=6, −56.2±1.6 mV; ACEA, n=6, −76.1±5.1 mV; * P <0.05). d4 Representative GABAergic (blue, left) and glutamatergic (blue, right) CB1R immunolabeling (red) in presynaptic terminals of POMC-GFP neurons (green). e Increased POMC cFOS by hyperphagic, but not by neutral CB1R activation (VEHI, n=3 mice, 36.3±3.6%; WIN, n=4, 69.9±7%; 1 mg/kg BW ACEA, n=3, 70.4±7.2%; 5 mg/kg BW ACEA, n=3, 29.8±2.6%; * P <0.05 vs. VEHI, P values by ordinary one-way ANOVA, followed by Dunett’s multiple comparisons test). f, g Local ARC hyperphagic CB1R activation induced pCREB-Ser133 (pCREB: VEHI, n=4 mice, 35.2±2.2%; ACEA, n=5, 55.8±3%) and cFOS (cFOS: VEHI, n=5, 38.7±5.4%; ACEA, n=5, 65.8±4.8%; ** P <0.01) in POMC cells. h, i RIMO decreased POMC cFOS (VEHI, n=6 mice, 12.1±2.8%; RIMO, n=6, 3.6±1.9%; * P <0.05). All values ± s.e.m. P values (unpaired comparisons) by two-tailed Student’s t-test. Scale bars; a, b, d4: 25 µm; f: 50 µm.

