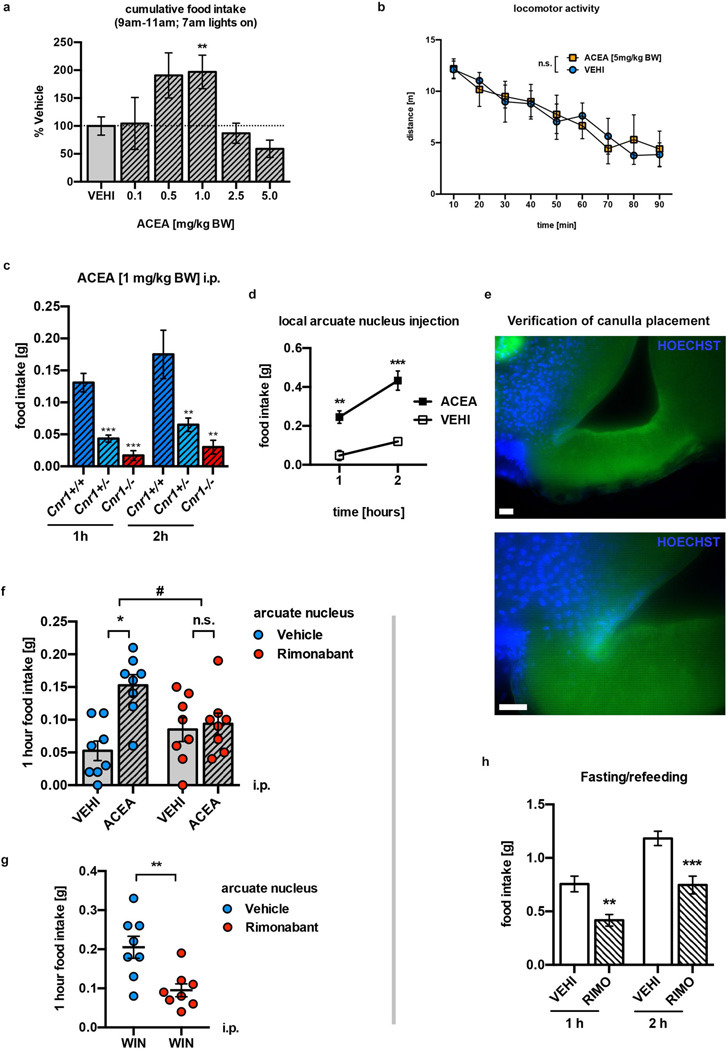
Extended Data Fig. 1. Characterization of CB1R-dependent food intake.
a Bimodal effects of different ACEA doses on food intake in fed mice (VEHI, n=23 mice, 100±16.3%; ACEA (in mg/kg BW, i.p.): 0.1, n=8, 104.5±46.6%; 0.5, n=3, 190.8±40.4%; 1.0, n=19, 196.7±30%; 2.5, n=16, 87.1±18%; 5.0, n=11, 59.2±15.5%; * P<0.05 vs. VEHI, P values by ordinary one-way ANOVA, followed by Dunett’s multiple comparisons test). b Neutral dose of ACEA on feeding (5 mg/kg BW, i.p.) did not alter locomotor activity of fed mice (n.s. P>0.05). c Impaired feeding response to ACEA (1 mg/kg BW, i.p.) in CB1R-heterozygote (Cnr1+/−, n=6 mice, 1 h: 0.04±0.01 g, 2 h: 0.07±0.01 g) and CB1R-deficient (Cnr1−/−, 1 h: n=6, 0.02±0.01 g, 2 h: n=4, 0.03±0.01 g) mice, when compared to CB1R-WT mice (Cnr1+/+, 1 h: n=12, 0.13±0.01 g, 2 h: n=4, 0.18±0.04 g; *** P<0.001, ** P<0.01 vs. Cnr1+/+, respectively). d Central, local ACEA injection into the ARC induced food intake (VEHI, n=4 mice, 1 h: 0.05±0.03 g, 2 h: 0.12±0.01 g; ACEA, n=4, 1 h: 0.25±0.03 g; 2 h: 0.43±0.05 g; ** P<0.01, *** P<0.001). e Verification of correct ARC cannula placement by HOECHST (blue) injection. f Hyperphagic CB1R activation (1 mg/kg BW ACEA, i.p.) was abolished by central, local ARC RIMO-mediated CB1R blockade (VEHI+VEHI, n=8 mice, 0.05±0.01 g; VEHI+ACEA, n=8, 0.15±0.02 g; RIMO+VEHI, n=8, 0.09±0.02 g; RIMO+ACEA, n=8, 0.09±0.02 g; * P<0.001, n.s. P>0.05, # P<0.05 for interaction between RIMO and ACEA, P values by ordinary two-way ANOVA, followed by Sidak’s multiple comparisons test). g Hyperphagic CB1R activation (1 mg/kg BW WIN, i.p.) was reduced by local ARC RIMO-mediated CB1R blockade (VEHI+WIN, n=8 mice, 0.21±0.03 g; RIMO+WIN, n=8, 0.1±0.02 g; ** P<0.01). h RIMO-induced hypophagic blockade of CB1R in fasted mice (VEHI, n=10 mice, 1 h: 0.76±0.07 g, 2 h: 1.18±0.07 g; RIMO, n=11 mice, 1 h: 0.42±0.05 g, 2 h: 0.75±0.08 g; ** P<0.01, *** P<0.001). All quantified results ± s.e.m. If not otherwise stated, P values (unpaired comparisons) by two-tailed Student’s t-test. Scale bars; 25 µm.

