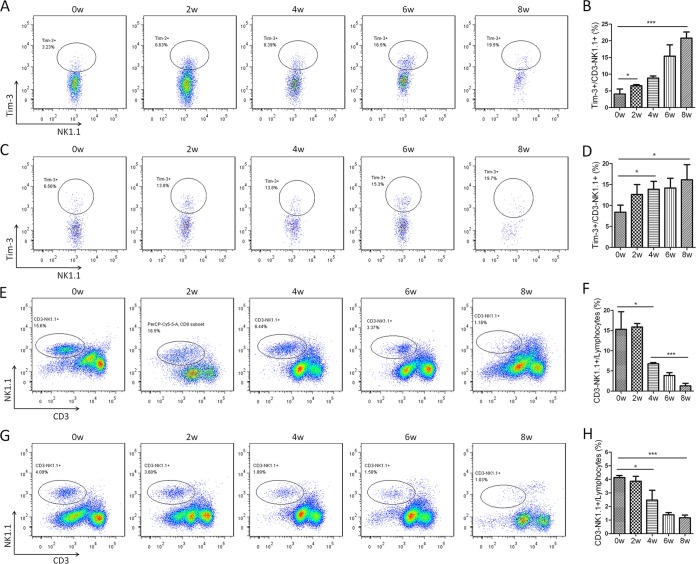
FIG 3.
Increased Tim-3 expression and decreased proportion of NK1.1+ cells in S. japonicum-infected mice. HMCs (A, B, E, and F) and splenic immune cells (C, D, G, and H) from S. japonicum-infected mice were collected at 0, 2, 4, 6, and 8 weeks postinfection. (A to D) Tim-3 expression on CD3− NK1.1+ cells was detected by flow cytometry. (A and C) Representative dot plots of Tim-3 expression on CD3− NK1.1+ cells. (B and D) Comparisons of the proportions of Tim-3+ cells within the CD3− NK1.1+ cell population among groups of mice at 0, 2, 4, 6, and 8 weeks postinfection. (E to H) CD3− NK1.1+ cell proportions as detected by flow cytometry. (E and G) are representative plots of CD3− NK1.1+ cell proportions in lymphocytes. The dot plots are representative of three independent experiments with five to seven mice in each group per experiment. (F and H) Comparisons of the proportions of CD3− NK1.1+ cells in lymphocytes (means ± SD; *, P < 0.05, **, P < 0.01; ***, P < 0.001).

