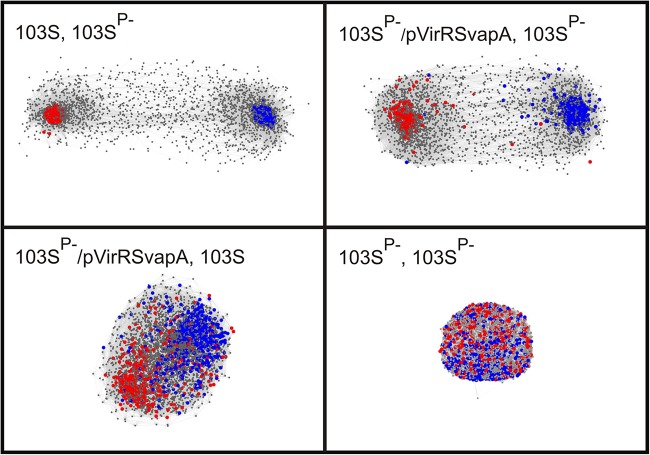
FIG 4.
Network analysis to show the impact of the pathogenicity island regulators VirR and VirS on the expression of chromosomal genes. Shown are pairwise comparisons of the transcriptomes of R. equi 103S (plasmid containing, virulent), R. equi 103SP− (plasmid cured, avirulent), and R. equi 103SP− expressing the virulence plasmid pathogenicity island genes virR, virS, and vapA (R. equi 103SP−/pVirRSvapA). 3D networks were made in BioLayout Express3D, version 2.2, using log2 RMA expression values at a correlation threshold of 0.85, with an MCL inflation of 2.2, and an edge/node filter setting of 10. Each network shows a pairwise comparison of the transcriptomes between different strains or between biological replicates of strain 103SP−. Genes are represented by nodes, which are connected by edges according to gene expression interrelationships above the threshold. Red and blue nodes represent genes that are up- and downregulated, respectively, in R. equi 103S relative to their expression in the plasmid-free avirulent strain R. equi 103SP− (>2-fold change [P < 0.05]). The colored nodes in each of the four networks refer to the same set of genes. Genes with nonsignificant differences in transcript levels are shown in gray. Node size: gray, 1; colored, 3. Edge thickness, 0.1. The analysis was performed with log2 RMA expression values obtained by analysis of oligonucleotide microarrays for four biological replicates.

