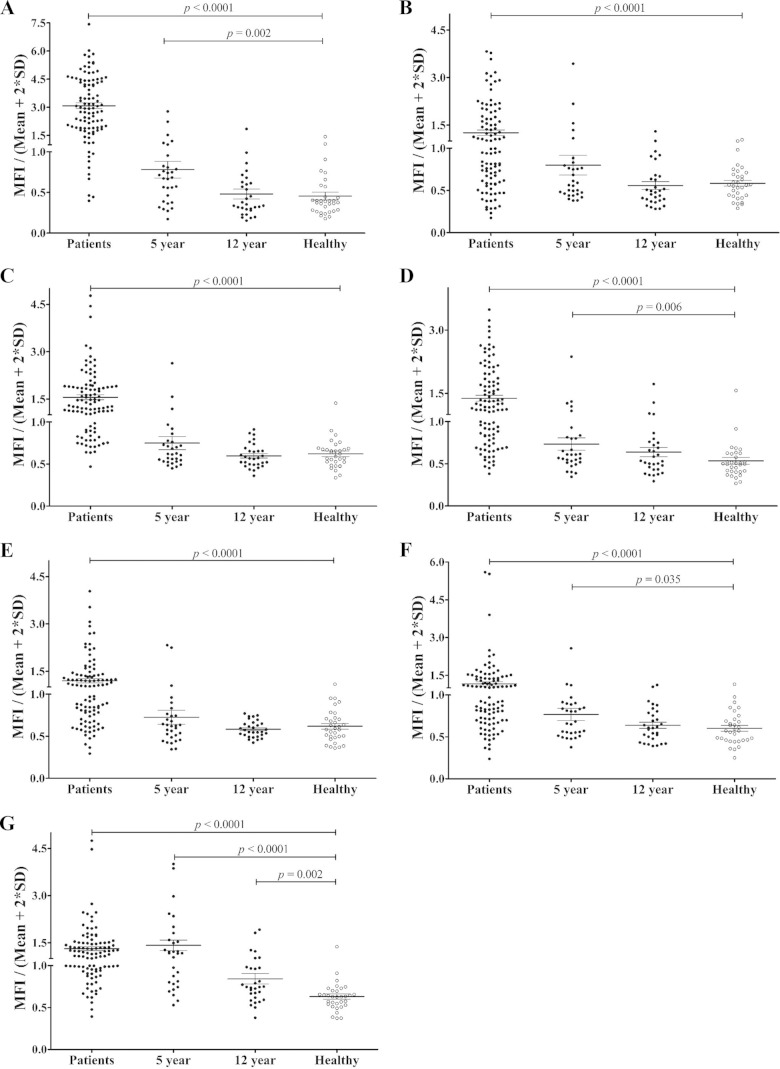
FIG 5.
IgG antibody responses to five recombinant PvTRAg proteins in the sera of malaria patients (Patients), archival vivax malaria patients (5-year and 12-year recovery), and malaria-naive individuals (Healthy). (A) PvMSP1-19. (B) PvAMA1. (C) PvTRAg_16. (D) PvTRAg_29. (E) PvTRAg_26. (F) PvTRAg_13. (G) PvTRAg_15. The vertical axis (MFI/Mean + 2SD) represents the mean fluorescence intensity divided by the mean fluorescence intensity plus 2 standard deviations of the malaria-naive samples. The horizontal bars indicate the means ± standard deviations. The P values were calculated using the Mann-Whitney U test.

