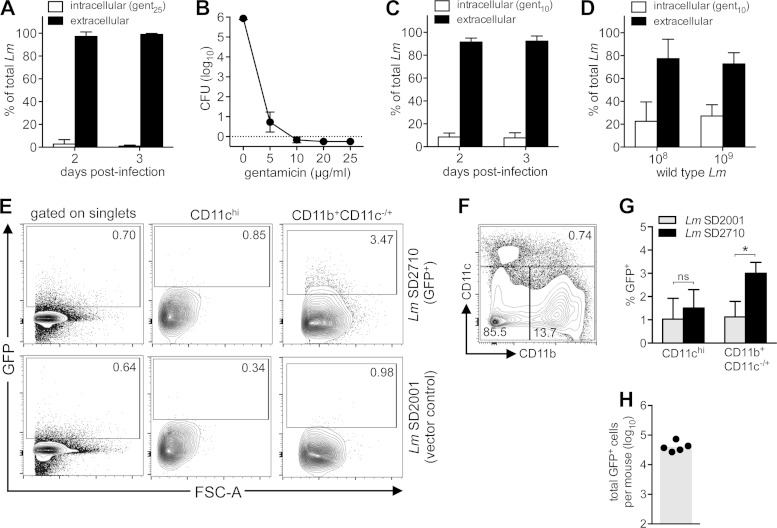
FIG 3.
The majority of L. monocytogenes in the MLN was predominantly gentamicin sensitive. (A) BALB mice were fed 3 × 10⁸ to 8 × 10⁸ CFU L. monocytogenes InlAm. Mean percentages (±SD) of intracellular (gent25r) and extracellular CFU in collagenase-treated MLN of mice harvested 2 (n = 6) and 3 (n = 11) days postinfection are shown. (B) Mean number (±SD) of L. monocytogenes SD2000 CFU surviving after 20 min of incubation at 37°C with CO2 at the indicated concentration of gentamicin. (C) BALB mice were fed 2 × 10⁸ to 7 × 10⁸ CFU L. monocytogenes InlAm, and MLN were dissociated using only enzymatic digestion (n = 7 to 11 per group). Mean percentages (±SD) of intracellular (gent10r) and extracellular CFU in the MLN are shown. (D) BALB mice were fed 3 × 10⁸ or 3 × 10⁹ L. monocytogenes EGDe (n = 4 per group), and MLN were dissociated using enzymatic digestion 3 days postinfection. Mean percentages (±SD) of intracellular (gent10r) and extracellular CFU in the MLN are shown. (E, F) BALB mice were fed 2 × 10⁸ to 5 × 10⁸ CFU of L. monocytogenes SD2710 (GFP+) or L. monocytogenes SD2001. MLN were collected 2 days postinfection and analyzed by flow cytometry. Representative dot plots showing the percentage of GFP+ cells in either total MLN (singlets) or the CD11chiCD11b−/+ and CD11b+CD11c−/+ populations are shown in panel E; the gating strategy is shown in panel F. (G) Mean percentages (±SD) of GFP+ cells in each myeloid-derived MLN population (n = 5 mice) are shown. Statistical significance was determined by two-tailed Mann-Whitney analysis. (H) Symbols indicate the total number of GFP+ cells identified in the MLN of each mouse; the shaded bar represents the mean value for the group.

