FIG 5.
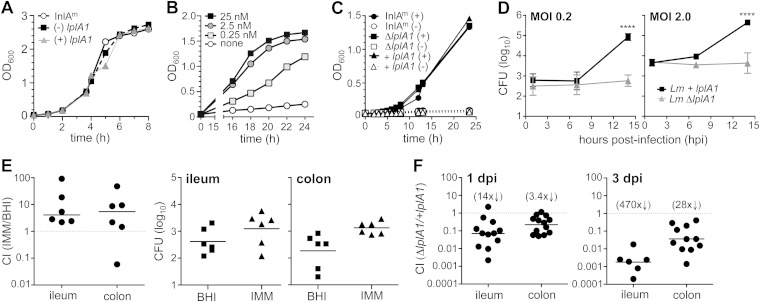
Lipoate-starved L. monocytogenes grew slowly in minimal medium but was able to establish intestinal infection in mice. Freshly streaked colonies of L. monocytogenes were incubated in IMM(-) overnight to deplete lipoate reserves and then diluted into fresh medium with or without lipoic acid (A to C) or frozen at −80°C prior to infection of cells (D) or mice (E). (A) The rates of growth in a rich medium (BHI) with shaking at 37°C were similar for L. monocytogenes SD2301 (ΔlplA1 mutant), the complemented mutant L. monocytogenes SD2302 (+ lplA1), and the parental strain (L. monocytogenes SD2000). (B) Lipoate-starved L. monocytogenes SD2000 had a long lag phase in IMM but achieved exponential growth in at least 0.25 nM lipoic acid. (C) The lplA1 deletion strain (ΔlplA1) and the complemented mutant (+lplA1) did not grow in the absence of exogenous lipoate but reached growth densities similar to those of the parental strain in IMM supplemented with 25 nM lipoic acid. (D) J774 cells were infected in triplicate, and the mean number (±SD) of gentamicin-resistant (10 μg/ml) CFU per well was determined over time. Statistical significance was determined by Mann-Whitney analysis. For panels A to D, data from one of at least two separate experiments are shown. (E) Mice were coinfected with a 1:1 ratio of L. monocytogenes SD2001 (Kanr InlAm prepared in IMM) and L. monocytogenes SD2002 (Eryr InlAm prepared in BHI) for a total inoculum of 2 × 10⁸ CFU. The population of tissue-associated L. monocytogenes in the ileum or colon was determined 24 h later and is shown both as a competitive index (CI) and as the absolute number of cell-associated CFU recovered from each mouse. (F) BALB mice were coinfected with a 1:1 mixture of L. monocytogenes SD2301 (ΔlplA1) and the complemented mutant L. monocytogenes SD2302 (+lplA1) for an average total inoculum of 8 × 10⁸ CFU. The tissue-associated L. monocytogenes population was determined and is shown as a CI; the fold difference from the hypothetical value of 1.0 is shown in the parentheses above. Pooled data from at least two separate experiments are shown.

