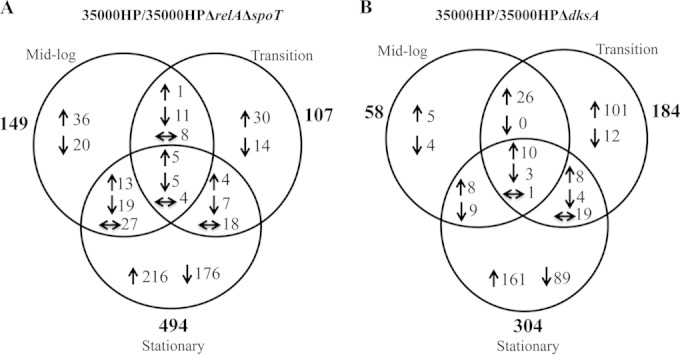
FIG 1.

Venn diagrams showing the number of genes differentially regulated by (p)ppGpp or DksA deficiency at different phases of growth. (A) H. ducreyi 35000HPΔrelAΔspoT mutant compared to strain 35000HP and (B) 35000HPΔdksA mutant compared to strain 35000HP. The total number of genes or operons differentially regulated in different phases of growth is indicated in bold type outside the circles of the Venn diagram. Upregulated (↑) and downregulated (↓) genes and genes regulated differently in different growth phases (← and →) are indicated.
