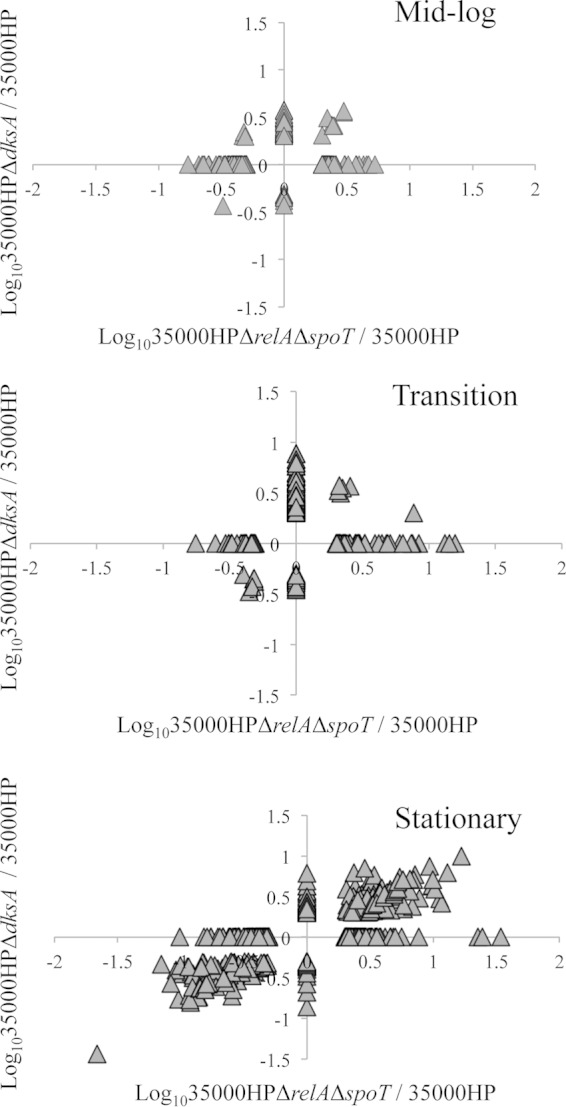
FIG 2.

Scatter plots showing fold changes in the expression of genes differentially expressed in 35000HPΔrelAΔspoT and 35000HPΔdksA mutant strains compared to 35000HP strain. The scatter plots were generated by plotting the log10-transformed fold changes in 35000HPΔrelAΔspoT mutant versus 35000HP strain against 35000HPΔdksA mutant versus 35000HP strain at different growth phases. Each triangle in the graph indicates a single gene.
