
FIG 5.
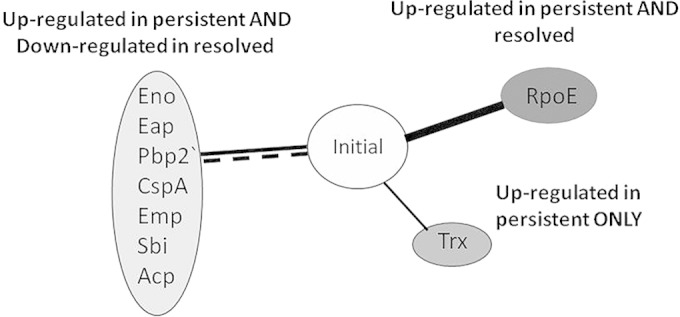
Summary of quantitative proteomic profiling of surface-associated proteins in EMRSA-15 persistent isolates and resolved-bacteremia EMRSA-15 isolates compared to the initial bacteremia isolates. Solid black lines indicate upregulation of proteins compared to the initial isolates; dashed lines indicate downregulation. The data representing the indicated proteins show changes relative to the initial isolates in one or more persistent or resolved isolate samples.