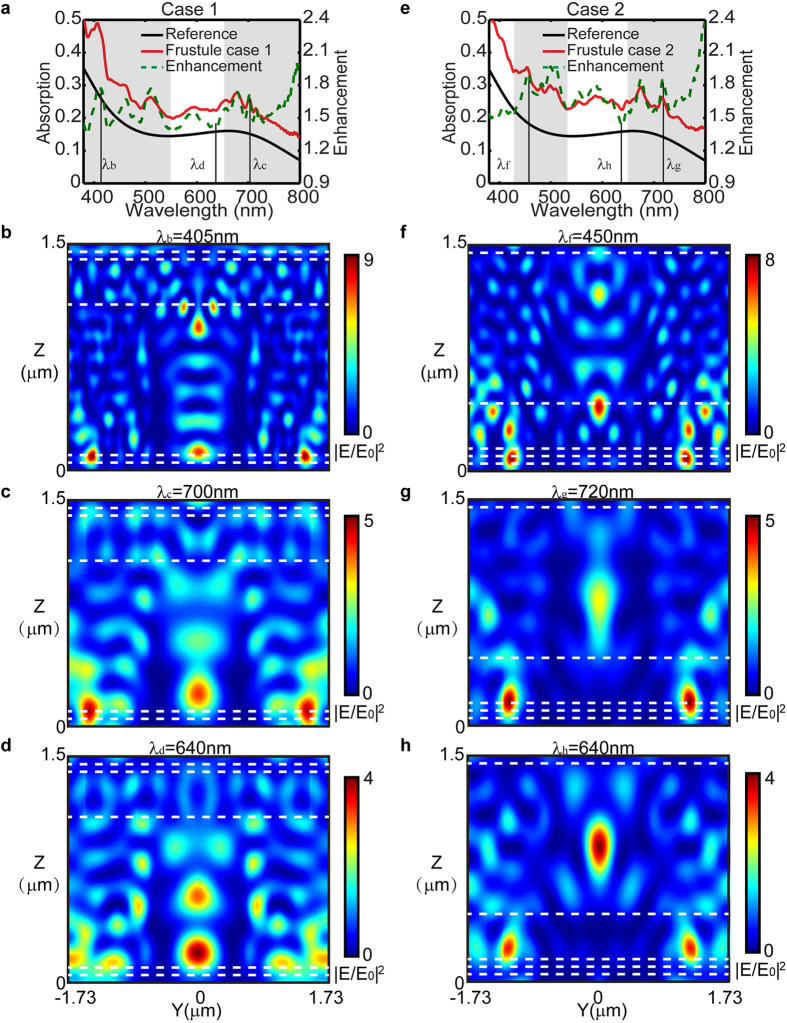
Figure 4.
FDTD simulated absorption spectra of the simplified diatom frustule model with the 50 nm thick active layer, case 1 (a) and case 2 (e). And normalized electric-field-intensity |E/E0|2 distribution on the Y-Z plane at λb (b), λc (c), and λd (d) for case 1, λf (f), λg (g), and λh (h) for case 2. Stacking sequence of case 1 (From top to bottom: air, cribellum, cribrum, internal plate, active layer and substrate), stacking sequence of case 2 (From top to bottom: air, internal plate, cribrum, cribellum, active layer and substrate).

