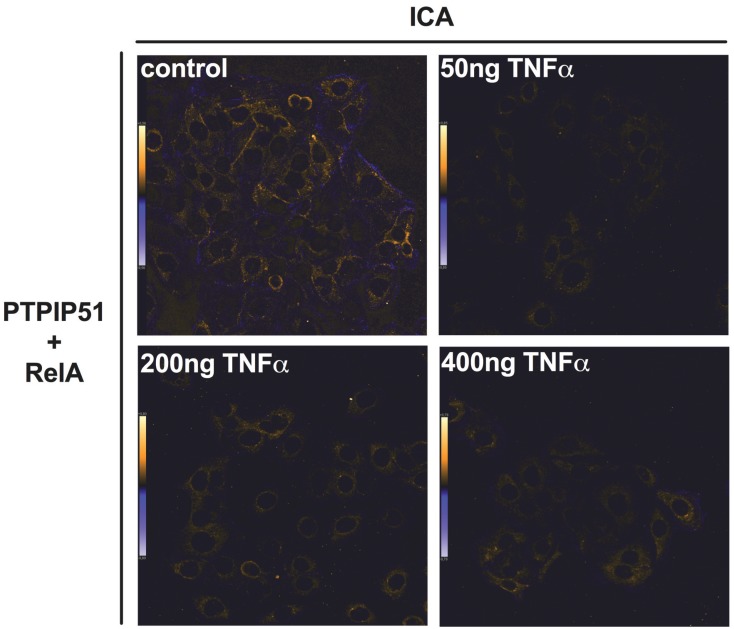
Figure 4.
Intensity correlation (ICA) of PTPIP51 and RelA. ICA was determined for PTPIP51 and RelA in untreated controls, 100 ng/mL TNFα treated cells, 200 ng/mL TNFα treated cells, 400 ng/mL TNFα treated cells. The co-localization of PTPIP51 and RelA is displayed in orange. Sites of non-co-localization are marked in blue.

