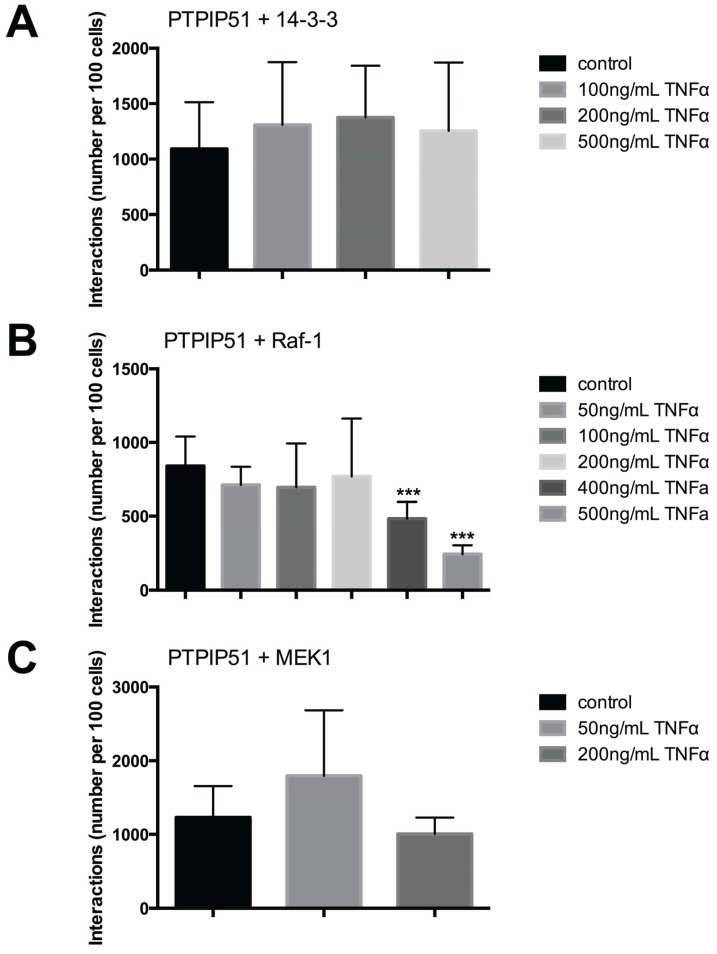
Figure 8.
Quantitative analysis of PTPIP51 and 14-3-3, PTPIP51 and Raf-1, PTPIP51 and MEK1 interactions evaluated by Duolink Image Tool software. (A) PTPIP51 and 14-3-3 interactions in human keratinocytes. Untreated controls, 50 ng/mL TNFα treated cells, 100 ng/mL TNFα treated cells, 200 ng/mL TNFα treated cells, 400 ng/mL TNFα treated cells, 500 ng/mL TNFα treated cells; (B) PTPIP51 and Raf-1 interactions. Untreated controls, 50 ng/mL TNFα treated cells, 100 ng/mL TNFα treated cells, 200 ng/mL TNFα treated cells, 400 ng/mL TNFα treated cells, 500 ng/mL TNFα treated cells. *** (p < 0.001); (C) PTPIP51 and MEK1 interactions. Untreated controls, 50 ng/mL TNFα treated cells, 100 ng/mL TNFα treated cells, 200 ng/mL TNFα treated cells, 400 ng/mL TNFα treated cells, 500 ng/mL TNFα treated cells. The resulting data were analyzed by GraphPad Prism 6 software, significance of results tested by Dunnett’s multiple comparisons test.

