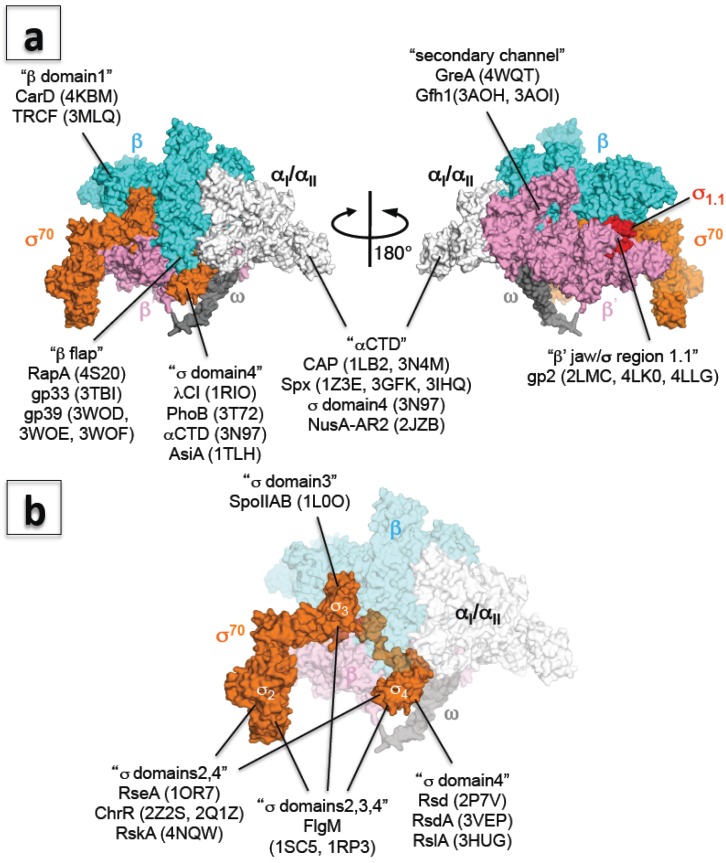
Figure 2.
(a) Three-dimensional representation of the interaction between RNAP and transcription factors. The E. coli RNAP holoenzyme is shown as a molecular surface representation (α subunits: white; β subunit: cyan; β’ subunit: pink; ω subunit: gray; σ70: orange; σ region 1.1: red). Transcription factors binding sites are indicated in double quotation marks and PDB codes of structures are shown in brackets; (b) Three-dimensional representation of the interaction between σ and anti-σ factors. E. coli RNAP holoenzyme is shown as a molecular surface representation, and only the core enzyme is partially transparent (α subunits: white; β subunit: cyan; β’ subunit: pink; ω subunit: gray; σ70: orange). Targets of anti-σ factors are indicated in double quotation marks and PDB codes of structures are shown in brackets.

