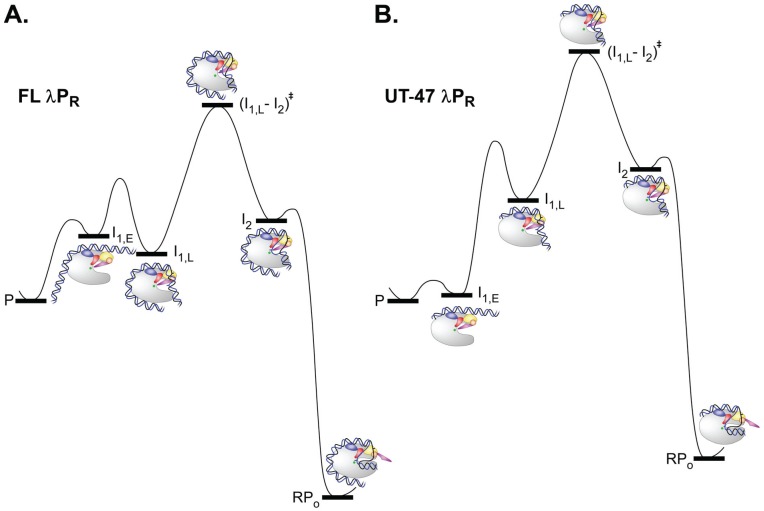
Figure 5.
Reaction progress diagrams for open complex formation by (A) FL and (B) UT−47 λPR, interpreted using Mechanism 2. Free energies of the rapidly-equilibrating closed intermediates I1,E and I1,L, the rate- determining transition state (I1,L-I2)‡, and the initial (I2) and stable (RPO) open complexes are calculated relative to promoter DNA (P) for [R] = 30 nM from experimentally-determined values of K1, k2, k-2 and kd for FL λPR [24,60] and UT-47 λPR [75] at 37 °C (see text for details). Free energies of FL and UT-47 λPR are set at the same value. For purposes of illustration, for both variants, we estimate that kopen = 1 s−1 and that (I1,L-I2)‡ decomposition frequencies are 103 s−1 in each direction, and assume that k-2 for UT-47 λPR is the same as that determined for FL λPR [24].

