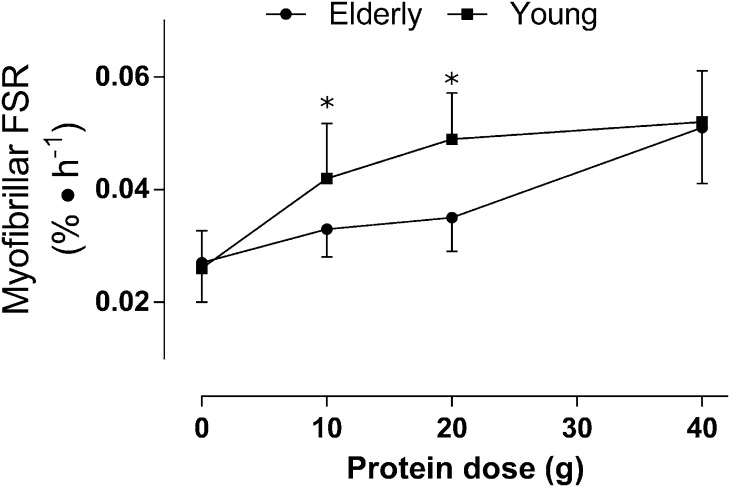
FIGURE 1.
Absolute protein dose-responses of skeletal muscle myofibrillar protein synthesis in older (71 ± 1 y; n = 43) and younger (22 ± 4 y; n = 65) men. Data are presented as means ± SEMs and were analyzed with a 2-factor ANOVA, but within-group dose differences are not indicated for the sake of clarity. *Significantly different between groups, P < 0.05. FSR, fractional synthetic rate. Adapted from reference 8 with permission.

