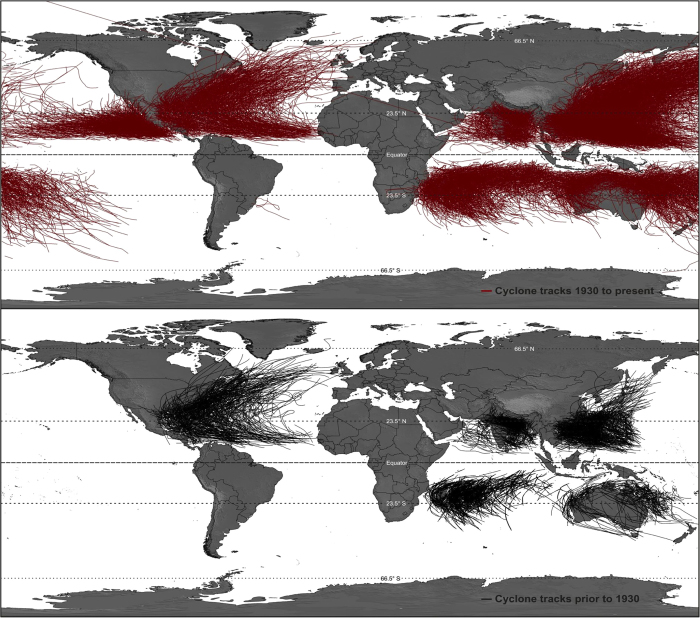
Figure 1. Map of the world TC tracks from International Best Track Archive for Climate Stewardship (IBTrACS).
(top) from 1931 to present days; (bottom) from 1841 to 1930; TC records prior to 1931 were based on only a single position estimate per day, while at the same time many parts of the globe were poorly sampled (Jarvinen et al., 1984). There are no data available prior to 1930 for the western Pacific Ocean along the North and Central American coast, while this region is prone to TC activities, especially due to the direct influence of El Niño/La Niña; (Figure made with ArcGIS® software and Corel Draw X5).

