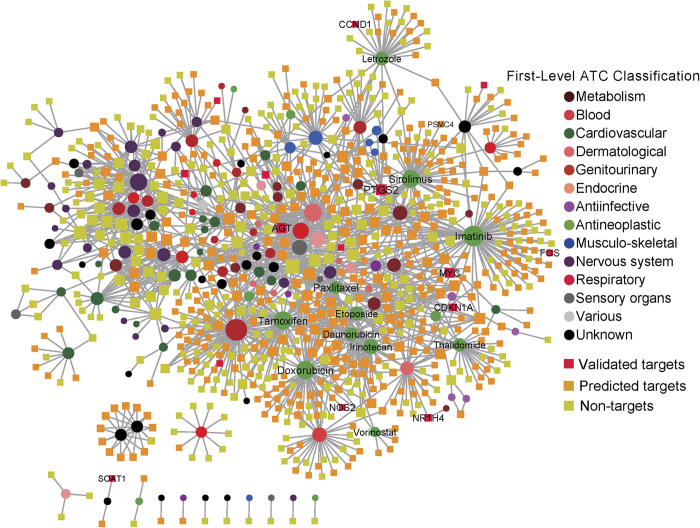
Figure 4. The STAT1-related drug-gene interaction subnetwork.
This network contains 761 drug target genes (square) and 148 drugs (circle) that either down-regulate or up-regulate STAT1 expression. The edges denote the drug-target interactions collected from DrugBank (v3.0), the Therapeutic Target Database (TTD), and the PharmGKB database. Genes were color-coded based on the STAT1 experimentally validated targeted genes (validated targets, red squares), computationally predicted STAT1 target genes (predicted targets, yellow squares), and unknown STAT1 target genes (non-targets, cyan squares). All drugs were grouped using the anatomical therapeutic chemical (ATC) classification system codes. This graph was visualized using Cytoscape v2.8.3 (http://www.cytoscape.org/).

