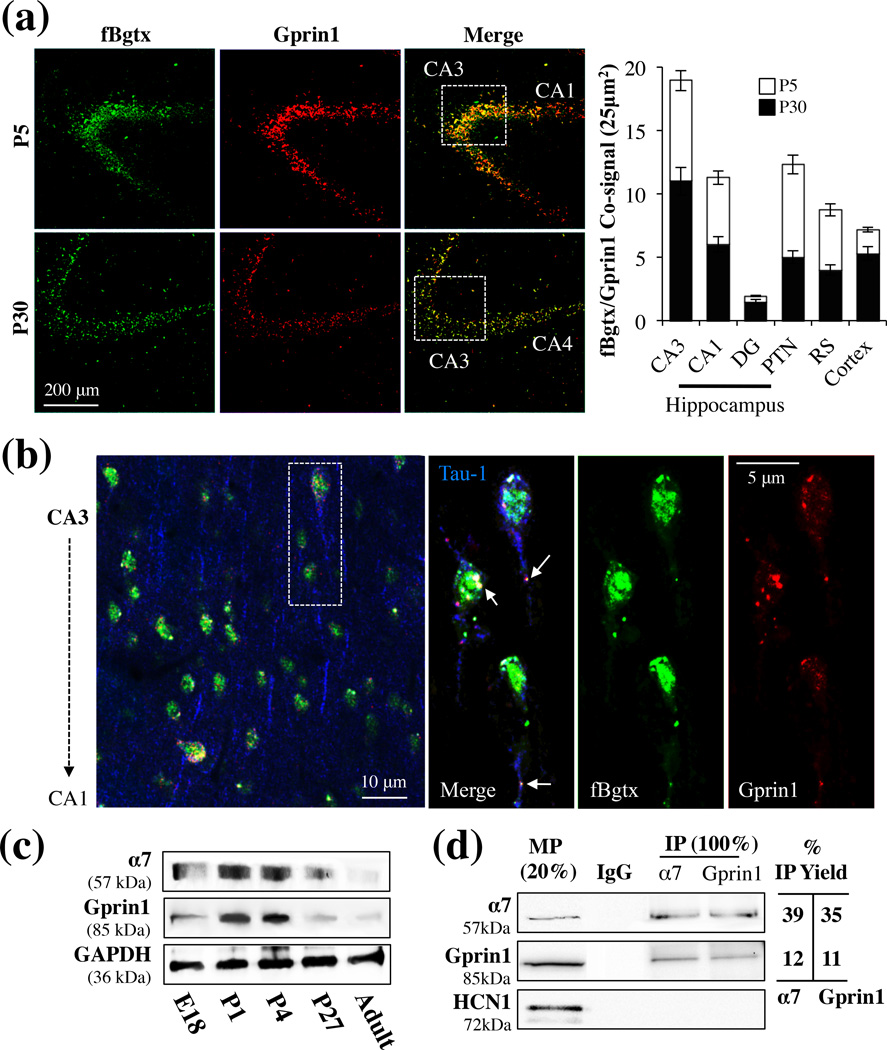
Fig. 1.
α7 and Gprin1 interact in the developing hippocampus. (a) Coronal slices of brains obtained from P5 and P30 rats. Slices were co-labeled with fBgtx and anti-Gprin1 Abs and visualized throughout the hippocampus, with prominent expression found in the CA3 region. Quantification of the co-signal in various brain regions is shown in the histogram. (b) Triple labeling for Tau-1 (blue), fBgtx (green), and Gprin1 (red) in CA3 at P5. Arrows point to colocalization of fBgtx and Gprin1 in soma and axons. (c) Western blot detection of α7 and Gprin1 in membrane protein (MP) fractions of the hippocampus. The same blot was used to probe for α7, Gprin1, and GAPDH as a loading control. (d) Western blot detection of α7 and Gprin1 interactions from P0 pups within IP experiments. In-gel digest confirms the identity of α7 and Gprin1 in the IP (Table S1). Top blot: α7; middle blot: Gprin1; bottom blot: HCN1. MP 20%: membrane protein as 20% of IP load (100 µg). IgG: IP control. IP Yield: amount of IP protein obtained as determined by the equation: optical density (O.D.) of IP bands/OD of 100% MP×100.

