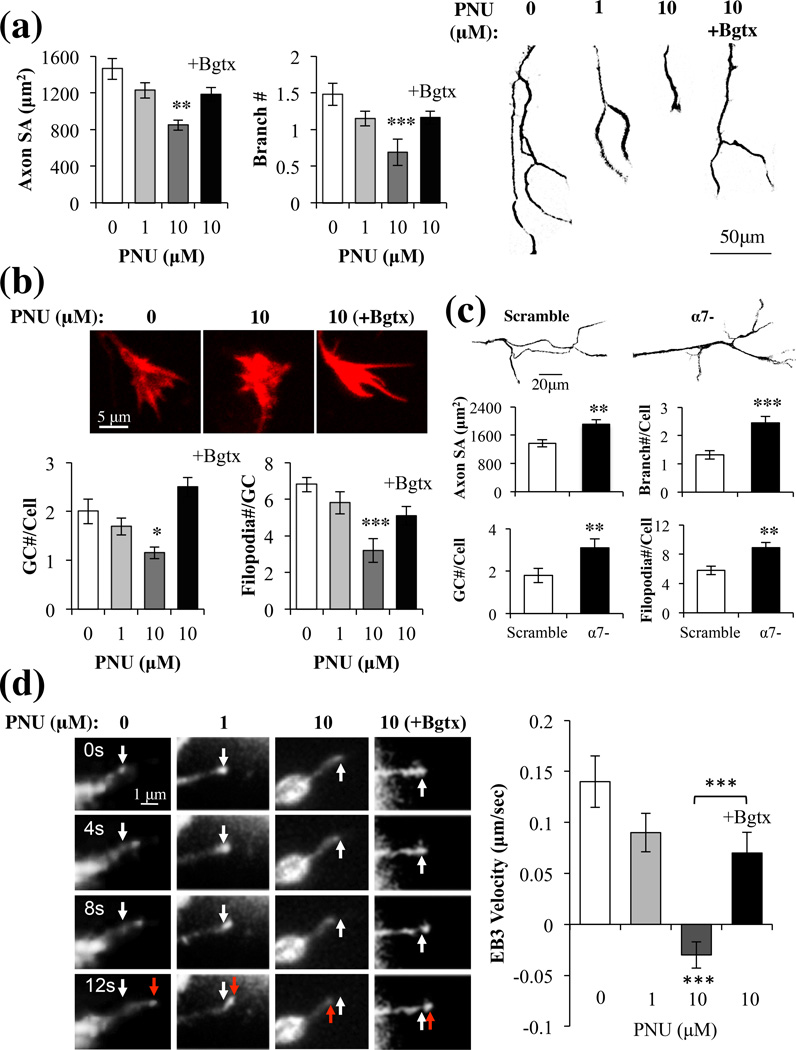
Fig. 3.
Activation of α7 inhibits axon growth. Hippocampal neurons were treated with multiple doses of PNU or a 0.1% DMSO control (PNU=0). (a) Analysis of surface area (SA) and branch number of Tau-1+ axons (left) represented as phase contrast images (right). (b) Images: GCs stained with rhodamine phalloidin. Histogram: an analysis of the GC. (c) Morphometric analysis of axons and GCs in α7- or scramble cells in the absence of drug treatment. (d) Images: RFP-EB3 comet movement (red arrow) from the starting position (white arrow) within the GC filopodia. Histogram: Changes in EB3 comet velocity with drug treatment. Bgtx (50 nM); Control (0.1% DMSO).

