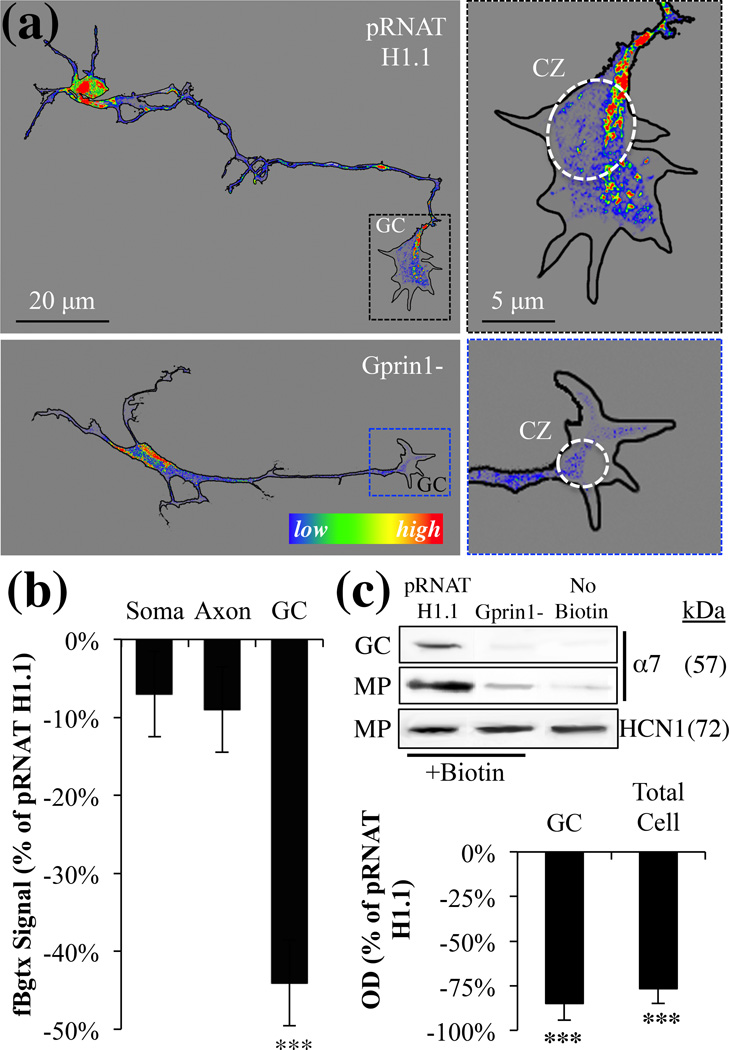
Fig. 5.
Gprin1 directs the localization of α7 to the cell surface of the growth cone. (a) pRNAT H1.1/Gprin1- cells were labeled with fBgtx for the visualization of α7 expression. Right panels: magnified images of the GC showing changes in α7 expression within the central zone and filipodia between the two conditions. The fBgtx signal is shown as heat map. (b) A quantification of the fBgtx signal in Gprin1- cells relative to empty pRNAT H1.1 controls. (c) Cell surface biotinylation was used to determine α7 expression at the cell surface in the GC and MP fraction. HCN1 was used as a negative control.

