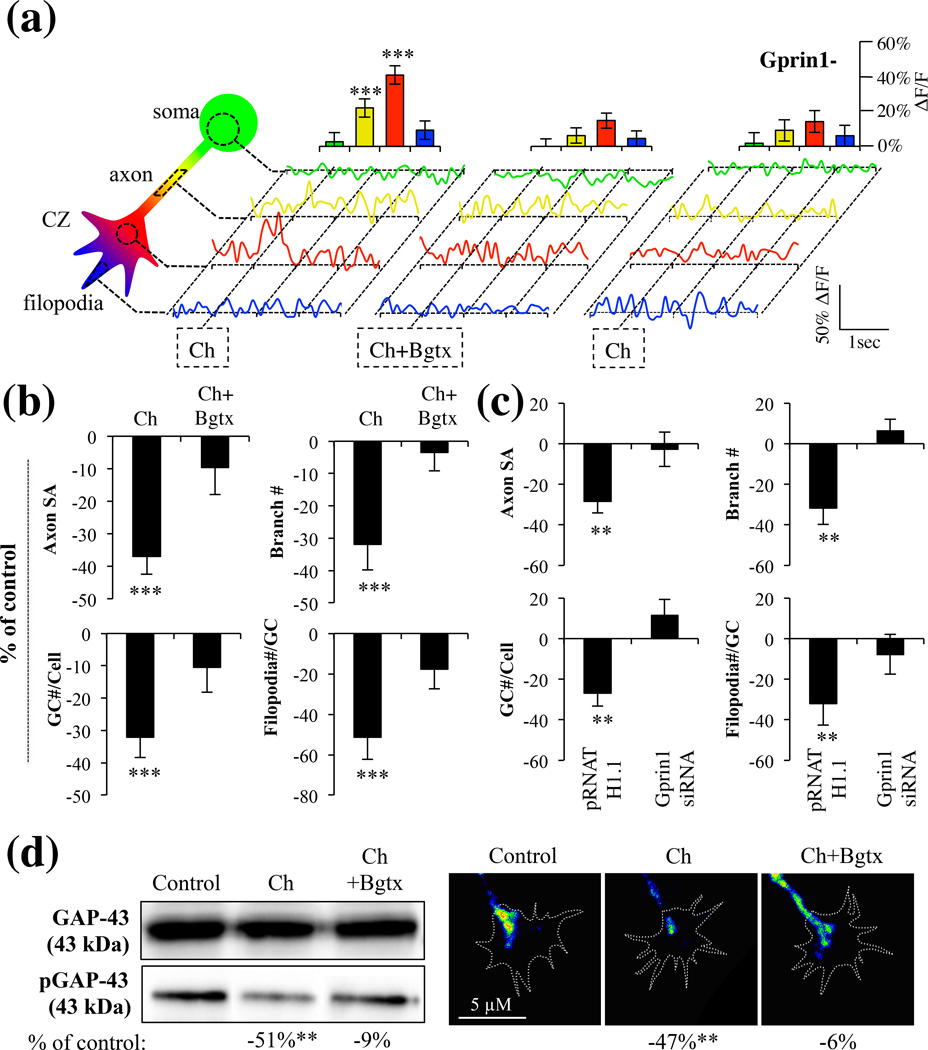
Fig. 7.
Choline activation of α7 in the growth cone. Cells were analyzed for intracellular calcium changes using Fluo-8AM in response to Choline (Ch) treatment. Ch=1 mM; Bgtx=50 µM. (a) Calcium detection in soma, axon, central zone, and filopodia of hippocampal neurons. Traces were averaged from 7 cells (n=7). Histograms show the relative change in calcium of peaks at the time of drug treatment. Water was used as a vehicle control. (b) Morphometric analysis of growth in choline treated cells. The data is contiguous with analysis presented in Fig. 3 confirming the effect of α7 on axon growth. Water was used as a vehicle control. (c) Morphometric analysis in Gprin1- cells treated with choline. The data is contiguous with analysis presented in Fig. 4 supporting the role of Gprin1 in α7-mediated inhibition of growth. Values are based on average percent change in axon growth from control cells (cells transfected with the same plasmid but treated with 0.1% DMSO). (d) Detection of GAP-43 and pGAP-43 in neurons following 60 min treatment with choline or choline and Bgtx. Changes in pGAP-43 expression were detected in the GC. Water was used as a vehicle control.

