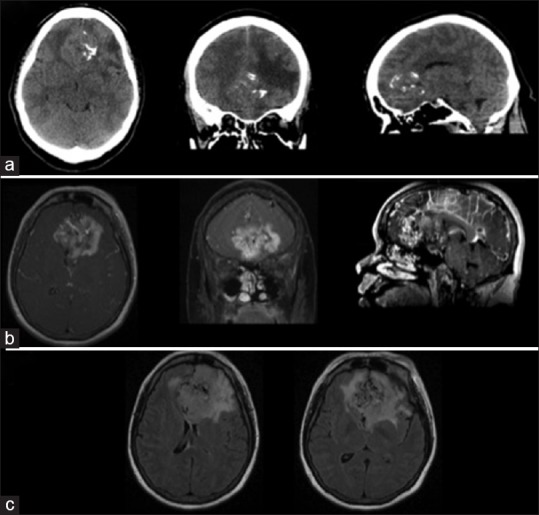
Figure 1.

Pretreatment imaging: Computed tomography (a) T1 magnetic resonance postcontrast (b) and fluid attenuation inversion recovery (c) showing 6 cm × 5 cm × 5 cm bilateral frontal lobe mass with internal coarse calcifications, marked enhancement, and surrounding vasogenic edema with multiple flow voids and large draining veins. There is abnormal tissue interspersed between vascular elements and large areas of cystic changes and necrosis
