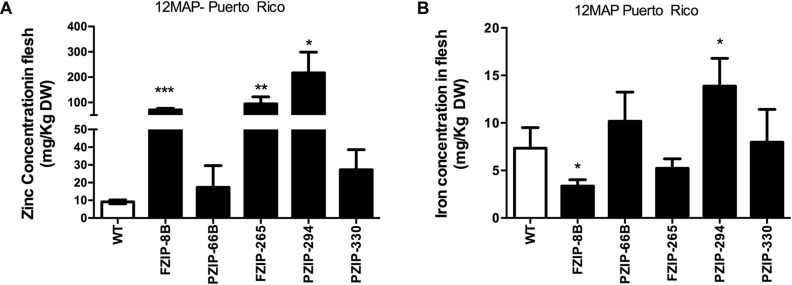
FIGURE 6.
(A) Zinc and (B) iron concentration in flesh of five independent transgenic PAT:AtZIP1 (PZIP) and FMV:AtZIP1 (FZIP) events after 12 months of growth in fields at Puerto Rico. Data represent the mean zinc content of three replicated plots, error bars indicate SD. Unpaired t-test comparison wild type vs. transgenic event. ∗P < 0.05, ∗∗P < 0.01, ∗∗∗P < 0.001. MAP, months after planting. FZIP denotes FMV:ZIP1 lines, PZIP denotes PAT:ZIP1 lines.

