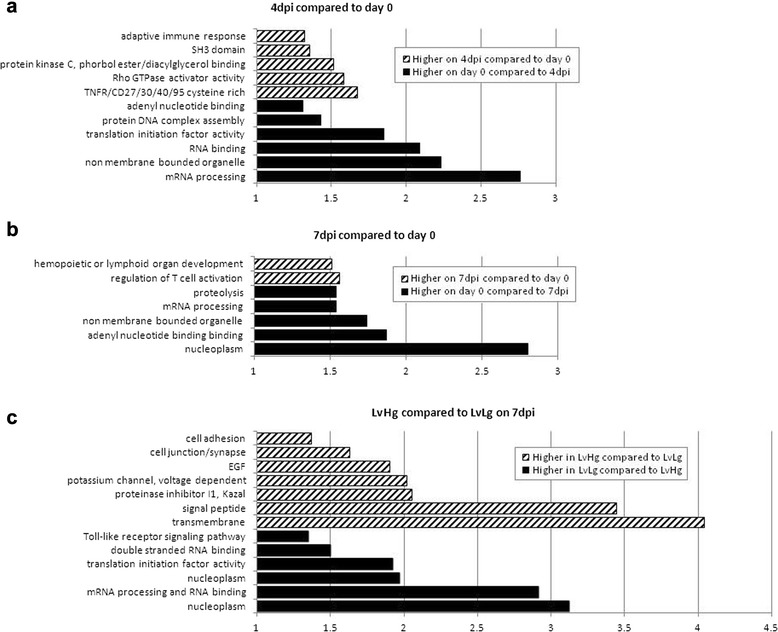
Fig. 2.

GO term annotation of DE gene lists compared between dpi. Significant clusters (Enrichment score p-value ≥ 1.30) are described by a given explanatory name. a GO terms that describe differentially enriched clusters between 4dpi and day 0 (striped bars: cluster more expressed in 4dpi data compared to day 0 data, black bars: cluster more expressed in day 0 data compared to 4dpi data). b GO terms that describe differentially enriched clusters between 7dpi and day 0 (striped bars: cluster more expressed in 7dpi data compared to day 0 data, black bars: cluster more expressed in day 0 data compared to 7dpi data). c GO terms that describe differentially enriched clusters between LvHg and LvLg animals in the 7dpi dataset (striped bars: cluster more expressed in LvHg animals compared to LvLg animals, black bars: cluster more expressed in LvLg animals compared to LvHg animals)
