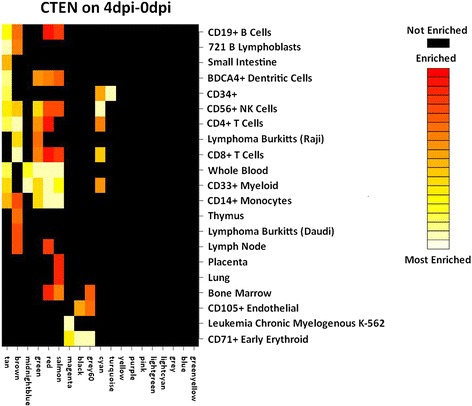
Fig. 4.

Cell Type Enrichment (CTEN) analyses on the 4dpi-0dpi dataset. The WGCNA clusters are noted along the abscissa. Black squares represent no enrichment in cell type. From red to yellow to white are all significant enriched cell-type specific genes within each module gene list (enrichment score ≥ 2.0), going from enriched to most enriched
