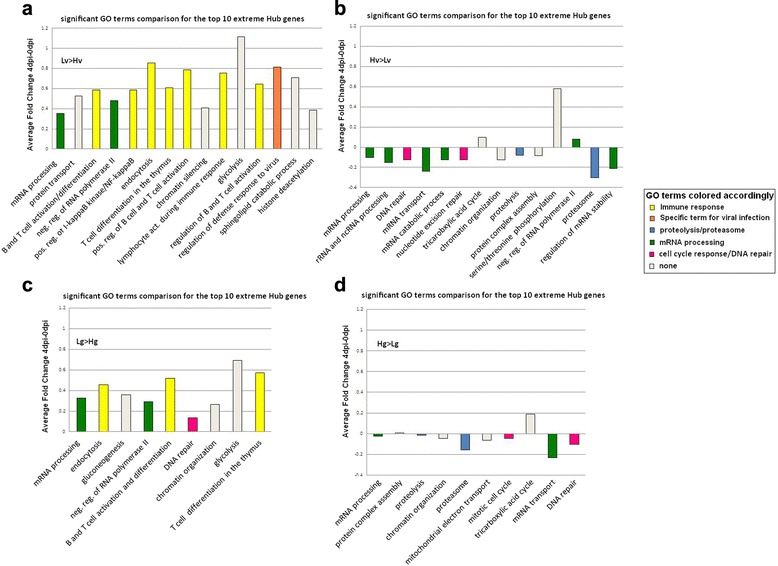
Fig. 5.

GO term enrichment for correlates of hub genes that contrast VL and WG. These hub genes are the top 10 genes with the most extreme wiring between VL (a and b) and WG (c and d) groups according to the PCIT analyses. On the Y axis, the average log2 fold change of the correlates that belong to a GO term is shown. Colors represent specific GO term groups as shown in the legend
