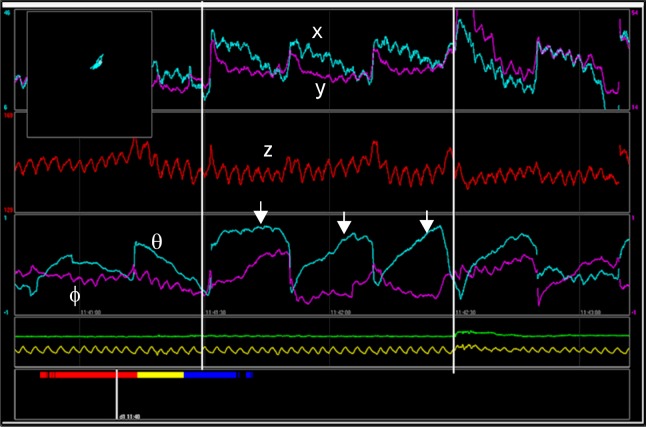
Figure 2.
Graphs depicting data from the ingested capsule using dedicated software. The position (x, y, and z) and orientation (Φ and θ) of the capsule are displayed. The arrows indicate the contraction frequency, in this case the 3 contractions per minute characteristic of the stomach. Yellow line displays respiration. In the upper left corner position of the capsule is monitored.

