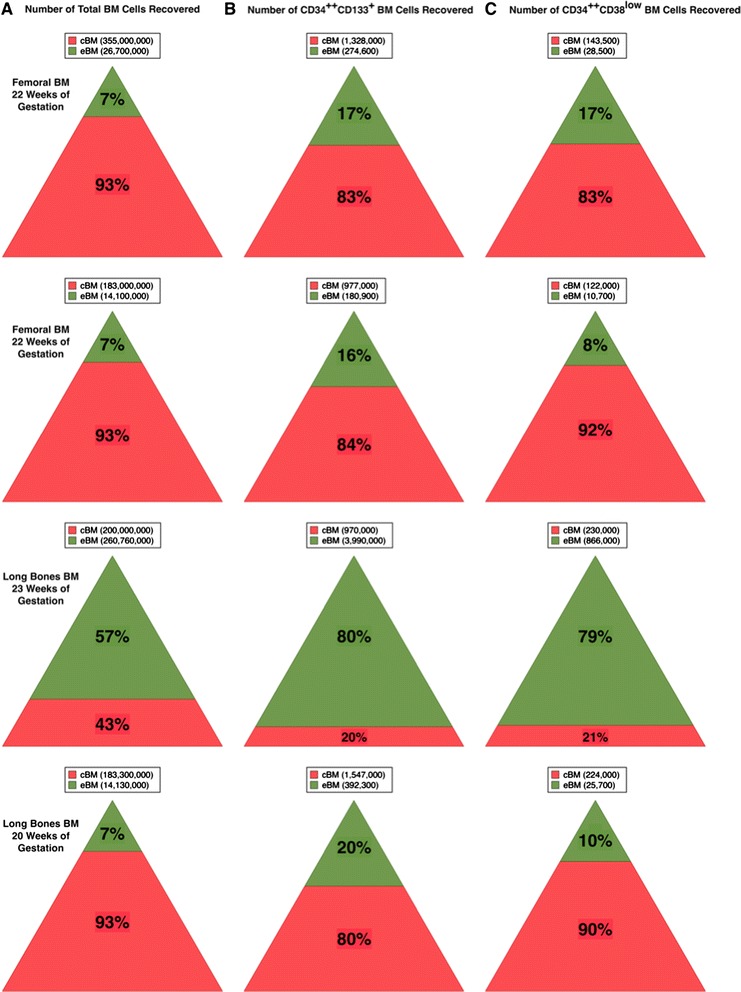
Fig. 5.

Isolation of human hematopoietic precursors from cBM and eBM. The relative recovery of total cells (a), CD34++CD133+ cells (b) and CD34++CD38low cells (c) from cBM and eBM are shown graphically for 4 samples. The number of cells recovered are indicated in the legends above each triangle
