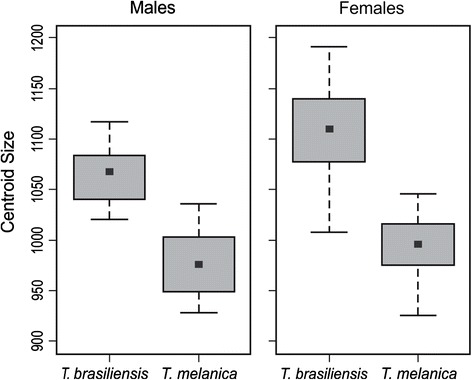
Fig. 2.

Wing centroid size variation among males and females of T. brasiliensis and T. melanica. This shows the sexual size dimorphism. The group mean is shown as a box between the quartiles (25th and 75th percentiles) and the standard deviations are shown as lines. Units are pixels
