
Fig. 6.
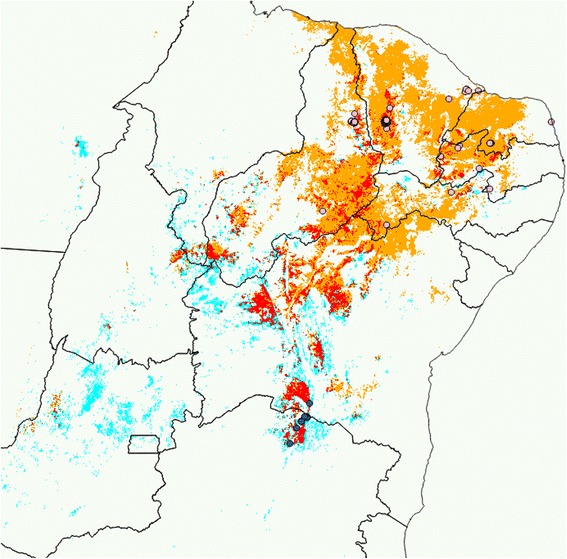
Modeling Disease Vector Occurrence. Geographic distribution of T. brasiliensis (orange), T. melanica (light blue) estimated by the generalized linear model for each species, and area where both models overlap (red). T. brasiliensis occurrence points (pink circles) and T. melanica occurrence points (blue circles)