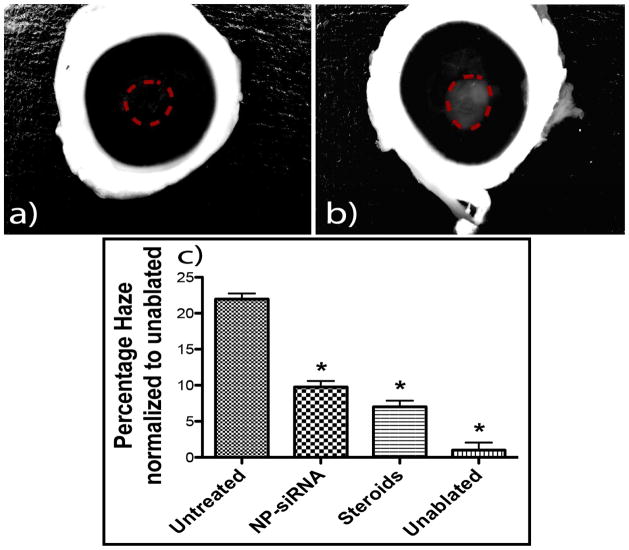
Figure 5. Evaluating the reduction in haze formation.
The processed images from Figure 2 were analyzed using Adobe Photoshop to quantify the amount of haze formation. The lasso tool in Photoshop was used to trace the area of the scarring region as shown in images a) and b). Percent haze is calculated by measuring the pixel intensity in these selected regions and normalizing it to area of the selected regions. Image c shows the percentage of haze expressed in the ablated corneas in terms of the unablated corneas. Asterisks indicate significant differences (p<0.05) of the experimental group compared to untreated corneas, calculated using ANOVA with Tukey’s HSD with n=3 in each experimental group.

