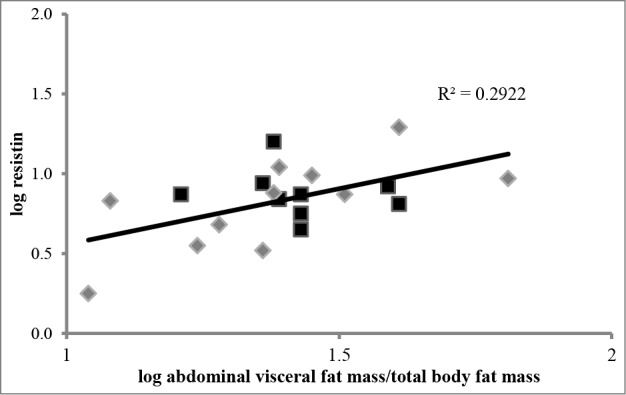
Figure 1.

Relationship of abdominal visceral fat mass/total body fat mass to circulating resistin. Data were log transformed and analyzed by simple linear regression. Black squares (▪) represent subjects with a normal-weight pre-pregnancy BMI (n = 9), gray diamonds (◊) represent subjects with an overweight or obese pre-pregnancy BMI (n = 11). Abdominal visceral fat mass/ total body fat mass predicted 29% of variance in resistin.
