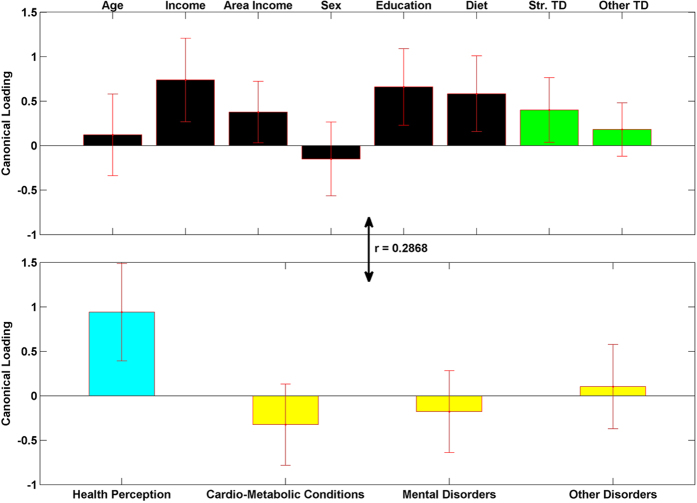
Figure 6. The second pair of linear composites for the canonical correlation analysis; F (21, 89297) = 211.0480), R2 = 0.0822, p < 0.0001.
Bars show correlation of each variable with the second set of weighted canonical scores. Error bars show ±2 standard errors containing both between and within imputation. Please notice the different colors for health perception (teal) and other three health condition variables (yellow). This is to emphasize that they have different coding directions in terms of a person’s well-being (more health perception is positive, more health conditions is negative).

