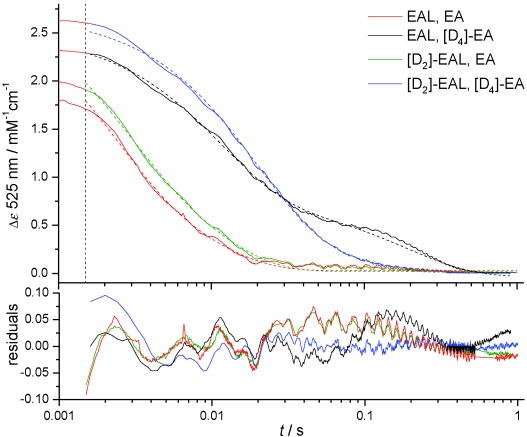
Figure 1.

Averaged stopped-flow transients showing the change in EAL or [D2]EAL absorbance at 525 nm upon mixing with saturating concentrations of EA or [D4]EA (0.5 mM post-mixing) at 277 K. The vertical dotted line indicates the stopped-flow dead-time of about 1.5 ms and only data collected at ≥1.5 ms were used for fitting to a double exponential function (dotted lines). Fitting parameters are given in Table 1.
