. 2015 Jul 9;4:e06554. doi: 10.7554/eLife.06554

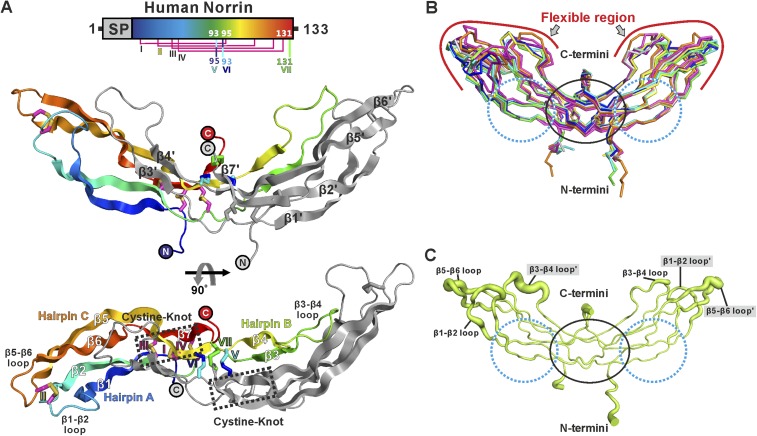
Figure 2. Crystal structure and structural analysis of apo Norrin.

(A) Schematic diagram of Norrin is rainbow coloured and disulphide bonds are drawn as lines. Cartoon representation of dimeric Norrin. Four intramolecular disulphide bonds are shown as magenta sticks. Cys93, Cys95, and Cys131 (forming intermolecular disulphide bridges) are shown as cyan, blue, and green sticks, respectively. Two cystine-knot motifs are marked with dotted boxes and the filled circles denote the N- and C-termini. (B) Ribbon diagram of superpositions of Norrin molecules from the asymmetric unit of crystal form I (green, chain A and B; cyan, chain C and D; magenta, chain E and F), crystal form II (yellow, chain A and B; blue, chain C and D), crystal form III (grey, chain A and B; purple, chain C and D), and MBP-Norrin (cyan; PDB ID: 4MY2). The flexible regions are highlighted as red lines. Loop regions (β1-β2 loop, β3-β4 loop, and β5-β6 loop) show structural plasticity. The well ordered regions include the cystine-knot motifs plus intermolecular disulphide linked areas (black circle) and two Fz4 binding sites (cyan dotted circle). (C) Representative Norrin dimer displayed with the diameter of the Cα tube defined by Cα atom B factor (small tube means structural rigidity; large tube indicates structural flexibility).

DOI: http://dx.doi.org/10.7554/eLife.06554.004

Figure 2.

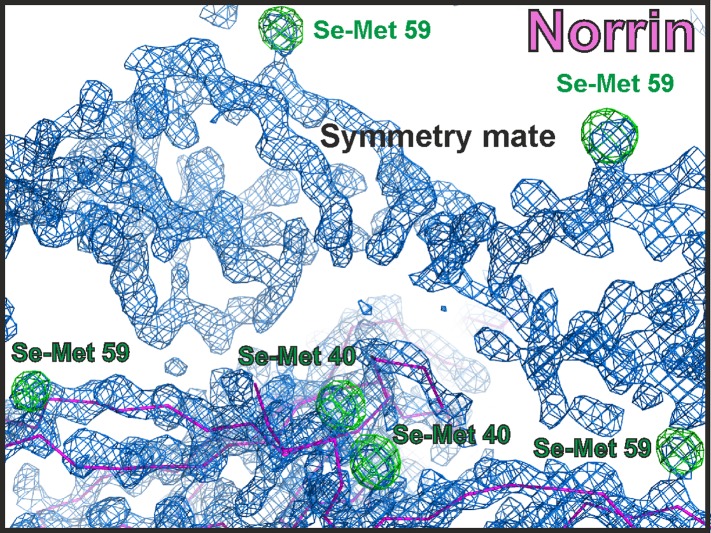
Figure 2—figure supplement 1. Electron density map of Norrin structure.

Figure 2—figure supplement 1.

The initial density modified map from PHENIX AUTOSOL (Terwilliger, 2000, Terwilliger et al., 2009) calculated with experimental Se-Met SAD phases is contoured at 1.5 σ and shown as blue meshes. The initial model from BUCCANEER (Cowtan, 2006) is shown as magenta ribbon diagram. The anomalous difference map for Se-Met is contoured at 4 σ as green meshes with Se-Met residues labelled.
Figure 2—figure supplement 2. Multiple sequence alignment of Norrin.

Figure 2—figure supplement 2.

Secondary structure element colouring corresponds to Figure 2A. The magenta boxes represent conserved cysteine residues in the cystine-knot growth factor superfamily, whereas the yellow boxes denote Norrin specific conserved cysteine residues. Disulphide bridges are numbered and are drawn in magenta lines for the intramolecular disulphide bonds. Three cysteine residues (highlighted in cyan) that form intermolecular disulphide bridges are drawn in cyan, blue and green lines. Triangles indicate the mutation sites for SPR binding and luciferase reporter assays. Residues involved in binding of Fz4, GAG, and Lrp5/6 are marked with blue, green, and yellow filled boxes, respectively. Residues involved in dimerization are highlighted with orange filled boxes. Black boxes denote the region of the Wnt8 index finger involved in Fz8CRD binding, which overlaps with Norrin for Fz4CRD binding (Figure 9). Disease-associated residues are marked by coloured dots according to the types of mutations (purple, missense; cyan, frame-shift; black, nonsense). Cysteine residues associated with diseases are marked below the sequence with red filled boxes. NCBI accession numbers: Human Norrin, NP_000257; Monkey Norrin, XP_528948; Panda Norrin, XP_002928194; Pig Norrin, NP_001106528; Dog Norrin, XP_855261; Bovine Norrin, AAI12739; Horse Norrin, XP_001490401; Rabbit Norrin, XP_002719919; Mouse Norrin, NP_035013; Chicken Norrin, XP_416765; Frog Norrin, NP_001154869; Fish Norrin, XP_001338820.
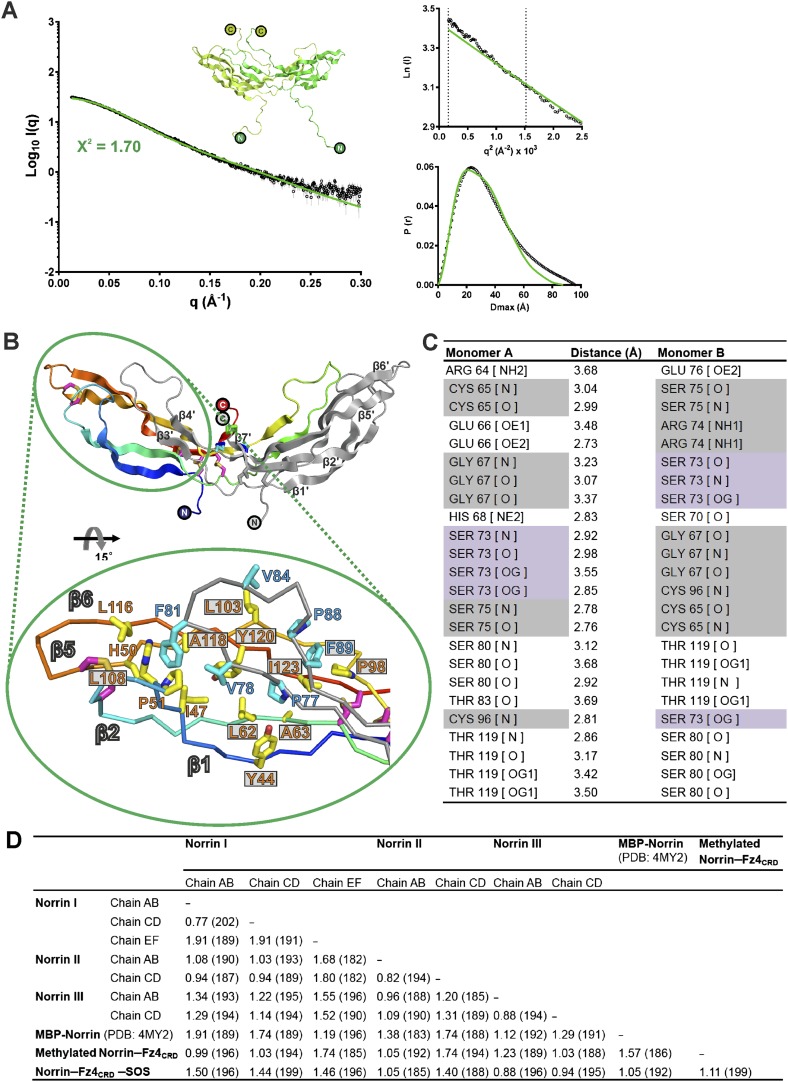
Figure 2—figure supplement 3. Norrin solution structure and structural analyses.

Figure 2—figure supplement 3.

(A) SAXS analysis of Norrin. The experimental scattering data (black circles) and calculated scattering pattern (green line) are shown and the Norrin solution structure model is shown in cartoon representation. The upper right inset shows the experimental (black circles) and calculated (green line) Guinier region. The dashed lines delimit the range of fitting for Radius of gyration (Rg) analysis (Rg·S ≤ 1.3). The bottom right inset shows the experimental (black line) and calculated (green line) pair distance distribution P(r) curve. (B) Hydrophobic interactions for Norrin dimerization beyond the cystine-knot motif. Resides on hairpin A and C (yellow sticks) form hydrophobic contacts with the residues on hairpin B (cyan sticks) from another monomer. Residues associated with diseases are boxed. (C) Table of hydrogen bond and salt-bridge interactions in the Norrin dimer interface. Missense and nonsense mutations are highlighted as filled grey and purple backgrounds, respectively. (D) Detailed information of structural comparison shown as root mean square (r.m.s) deviation (Å) values and the number of aligned Cα atoms (in brackets).