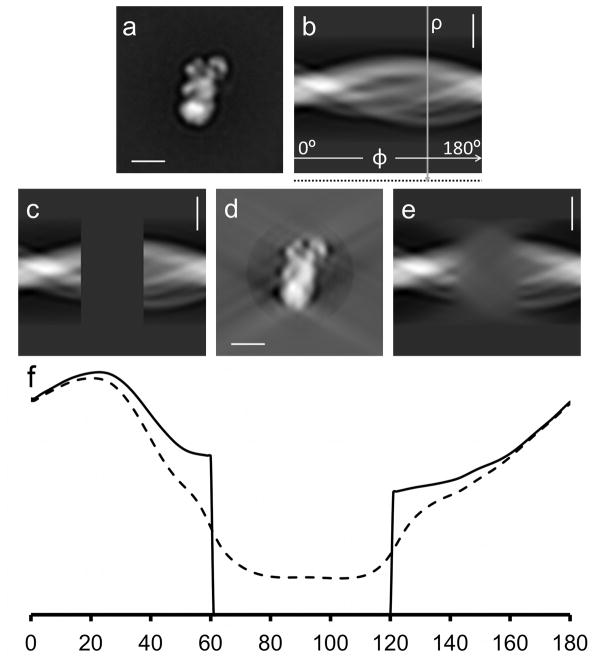
Figure 2.
Localization of missing data regions using the line variance of the Radon transform. a) Average image of a subcomplex of complex I from Y. lipolytica also used in section 4. b) Radon transform of the image. Angular coordinate Φ from 0° to 180°, radial coordinate ρ. The vertical arrow indicates a line along which the standard deviation is calculated. Standard deviation values are stored at the end of each line of the transform indicated by the dotted line in the margin below (b). c) The same Radon transform with 1/3 of the data set to 0 (33% missing data). d) r*-weighted back-projection calculated from the Radon transform with missing data. e) Radon transform calculated from the reconstructed image in (d). Note that the missing data are not 0 anymore but instead the transform shows data with a blurred appearance in the corresponding area. f) Plot of the standard deviations of the values in the radial lines of a Radon transform versus angle, calculated from a high-pass filtered version of the 2D Radon transforms shown in (c), solid line and (e) dashed line, ρ* being the radial coordinate in the Fourier transform. The missing data area can be detected from the standard deviation values that fall below a certain threshold. Scale bars 100Å.

