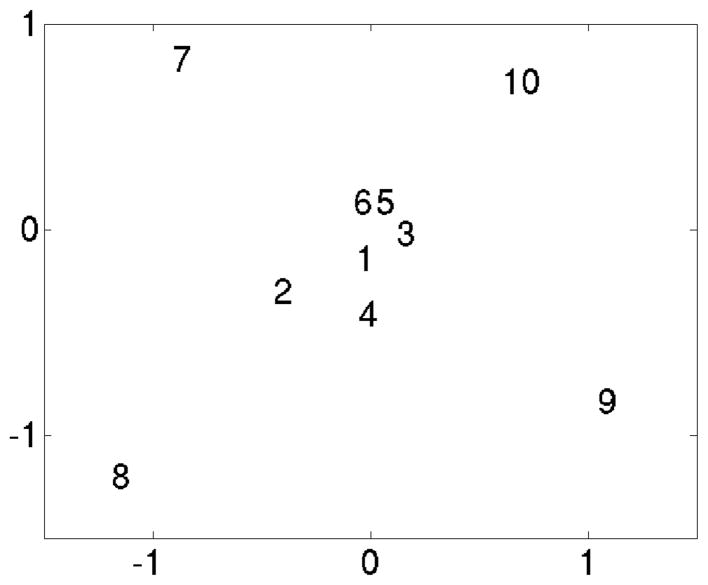
Figure 5.
Scatter plot of the 10 volumes. PPCA-EM was applied to the aligned volumes, shown is the non-linear map obtained from the coordinates in the first 3 eigenvectors. The numbers corresponds to the volumes numbers in Figure 4. Distances scaled by 10−4.

