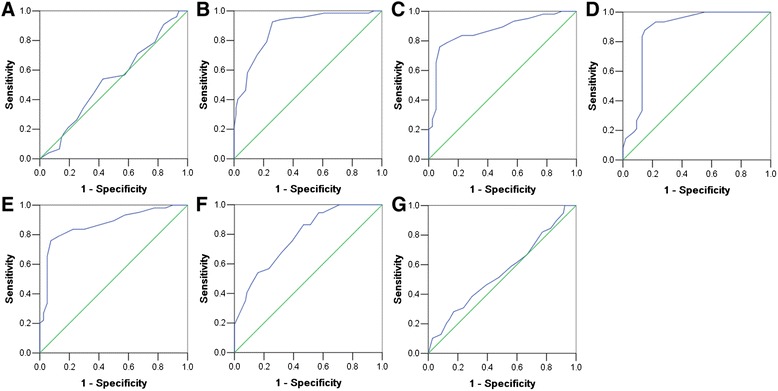
Fig. 2.

Determination of the cutoff value of high Six1 expression in prostate cancer tissues by ROC curves. The sensitivity and 1-specificity were plotted for each clinical characteristic, including age (a), pathological grade (b), clinical stage (c), Gleason grade (d), pT status (e), pN status (f), pM status (g)
