
Figure 2.
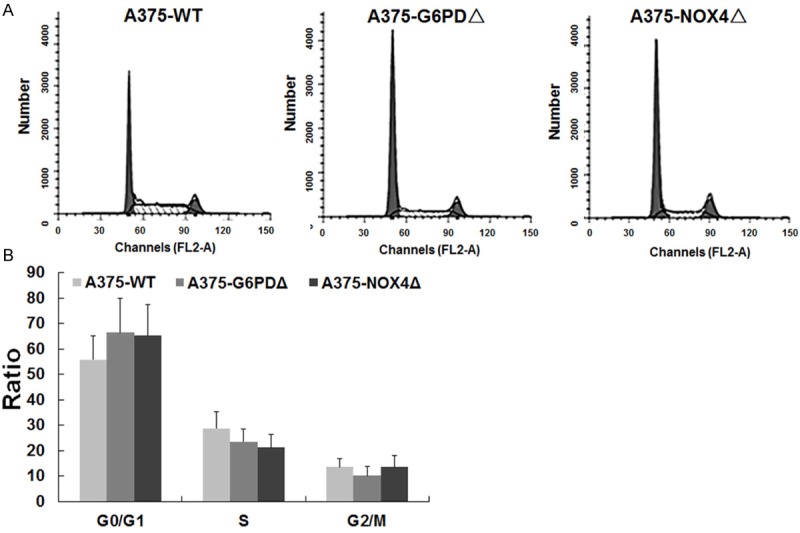
Effect of G6PD and NOX4 silencing on cell cycle progression. Cell cycle distribution of the indicated cell lines determined by flow cytometry of propidium iodine stained cells. The X-axis shows propidium iodine fluorescence, which is proportional to the DNA content. The Y-axis indicated cell numbers; B. Quantification of the flow cytometry profiles shown in A.