
Figure 4.
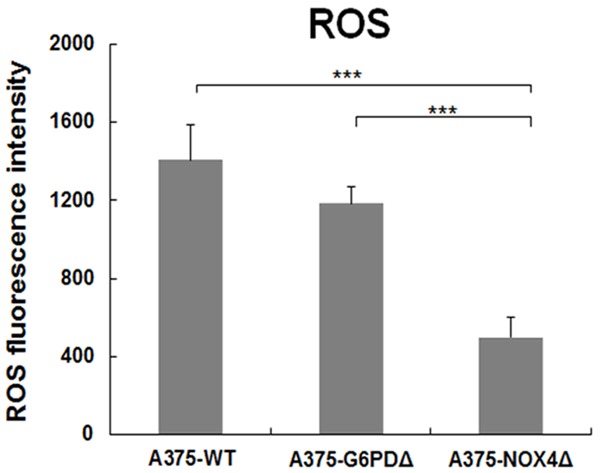
ROS levels in A375-WT, A375-G6PDΔ and A375-NOX4Δ cells. ROS levels were determined in the indicated cell lines by measuring DHE fluorescence during flow cytometry. The graph displays average results from three independent experiments and error bars represent the SD. ***P < 0.001.